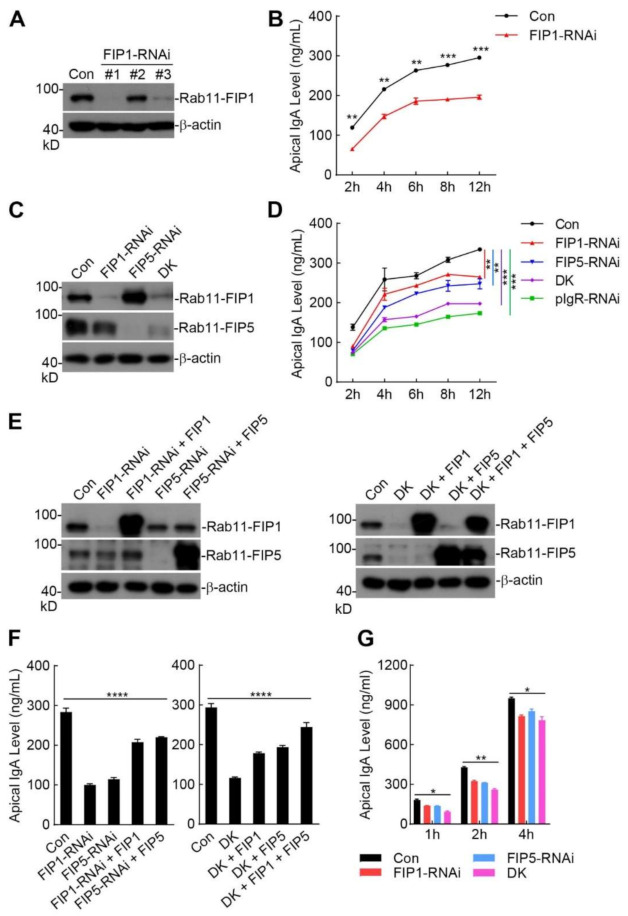
Figure 3.
Knockdown of Rab11−FIP1 or Rab11−FIP5 impairs extracellular secretion of pIgA. (A,B) Effects of Rab11−FIP1 knockdown on extracellular secretion of pIgA. (A) Vero−pIgR cells were transduced with control (Con) or the indicated Rab11−FIP1−RNAi plasmids. The knockdown efficiencies were detected by immunoblotting analysis. (B) The control and Rab11−FIP1−RNAi Vero−pIgR cells (1 × 10⁵) (Rab11−FIP1−RNAi #1 plasmid was used) were grown on Transwell for 3 days. An amount of 20 µg pIgA was added to the basal chamber for the indicated time points. The supernatant was collected for IgA analysis by ELISA. (C,D) Effects of double knockdown of Rab11−FIP1 and Rab11−FIP5 on extracellular secretion of pIgA. (C) Vero−pIgR cells were transduced with the control or indicated RNAi plasmids by retroviral−mediated gene transfer to establish stable cell lines. The knockdown efficiencies of these genes in their cell lines were detected by immunoblotting analysis. (D) The indicated Vero−pIgR cells (1 × 10⁵) were grown on Transwell for 3 days. An amount of 20 µg pIgA was added to the basal chamber for the indicated time points. The supernatant was collected for IgA analysis by ELISA. DK: double knockdown. (E,F) Effects of reconstitution of Rab11−FIP1 knockdown, Rab11−FIP5 knockdown, Rab11−FIP1 and Rab11−FIP5 double-knockdown cells with Rab11−FIP1 or Rab11−FIP5 plasmids on extracellular secretion of pIgA. (E) The indicated knockdown Vero−pIgR cell lines were transduced with the indicated plasmids. The knockdown and reconstitution efficiencies of these proteins were detected by immunoblotting analysis. (F) The indicated Vero−pIgR cell lines (1 × 10⁵) in (E) were grown on Transwell for 3 days. An amount of 20 µg pIgA was added to the basal chamber for 4 h. The supernatant was collected for IgA analysis by ELISA. DK: double knockdown. (G) The Vero−pIgR cells (1 × 10⁵) were grown on Transwell for 6 days. An amount of 20 µg pIgA was added to the basal chamber for the indicated time points. The supernatant was collected for IgA analysis by ELISA. Data of (B,D) were analyzed by unpaired, two−tailed Student’s t−test. Data of (F,G) were analyzed by Kruskal−Wallis one−way ANOVA. Graphs show mean ± SD; n = 3. * p < 0.05, ** p < 0.01, *** p < 0.001, **** p < 0.0001. Data of (A–G) are representative of three independent experiments. FIP1 was abbreviated form of Rab11−FIP1, FIP5 was abbreviated form of Rab11−FIP5.

