
Figure 2. Compression of Morbidity by AKG Treatment.
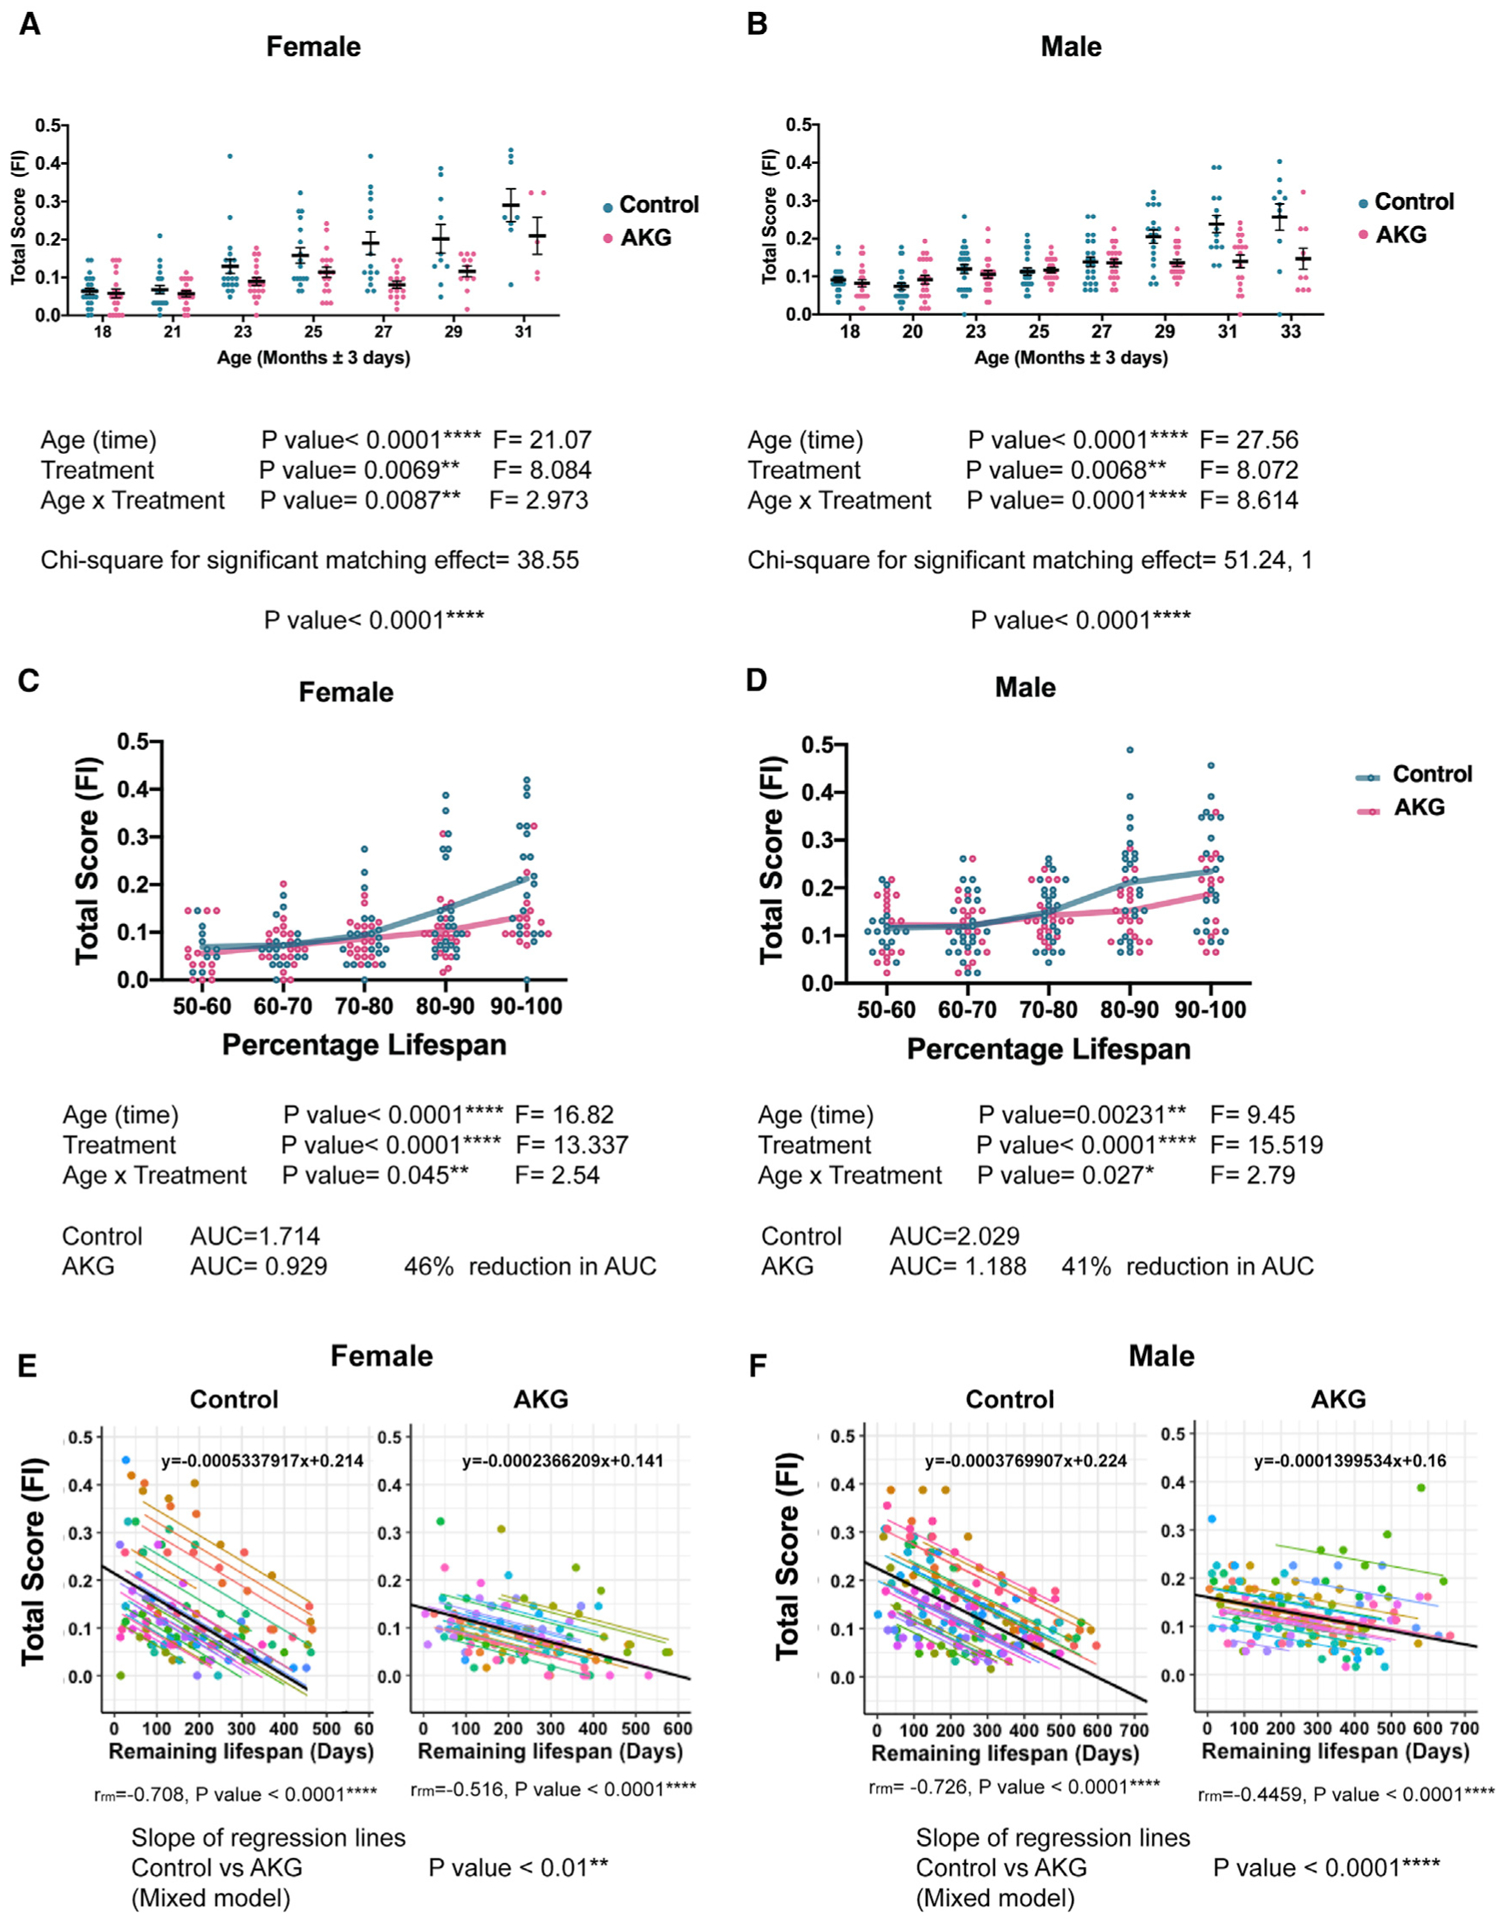
(A and B) Separately graphed (A) female and (B) male total frailty index (FI) scores during lifespan, comparing control mice (blue) to those fed AKG in the diet (pink) starting at the 18th month. Each dot is the total score of one animal at specific age as indicated. Data are mean ± SEM of each group. n = all animals alive at each measurement time. Mixed model was used to analyze the data longitudinally. In the current mixed model, every mouse with a unique ID was treated as a random effect. Treatment and time were treated as fixed effects. The low p value for chi-square for significant matching effect indicates that the pairing was effective; comparing the fit of the current mixed model to a simpler ANOVA, ****p < 0.0001. As the animal ages and gets closer to death (higher percentage of lifespan), it manifests several aging phenotypes and will be at its highest multi-morbidity risk. We considered the total scores of 31 phenotypes as a morbidity score.
(C and D) Separately graphed (C) female and (D) male mice total FI scores as their percentage of lifespan. AKG treatment postpones the occurrence of aging phenotypes during lifespan and compresses the morbidity risk into fewer days of life in both sexes. Each dot is the total score of one animal. Lines are mean ± SEM of the group. n = all animals alive at each time. Two-way ANOVA was used for comparison. The area under the frailty curves (AUC) were calculated to measure the percent comparison of morbidity.
(E and F) The total scores for each mouse were plotted against remaining life (life expectancy). Repeated-measures correlation (rmcorr) was applied for AKG and control groups separately and rmcorr coefficients (rrm), and associated p values have been indicated. Dots and specific regression lines for each mouse with unique ID are color coded. There are negative correlations between total score and life expectancy in both control and AKG for both sexes. We also reported the slopes of the regression lines, which computed by rmcorr for AKG and control separately (black lines). The equation of each regression line is shown (y = ax + b). Where x is the explanatory variable, a is the slope of the line, and b is the intercept. The results suggest a decrease in magnitude of slope for AKG treatment compared to control. To further prove that this difference is statically meaningful, we applied a mixed model to the combined dataset of AKG and control. In the current mixed model, we treated remaining life and treatment as fixed effects and every mouse as a random effect. The reported p value for regression lines is the result of analysis of variance (ANOVA) for the slopes. AKG treatment can significantly decrease the rate of linear relationship between life expectancy and total score in both males and females.