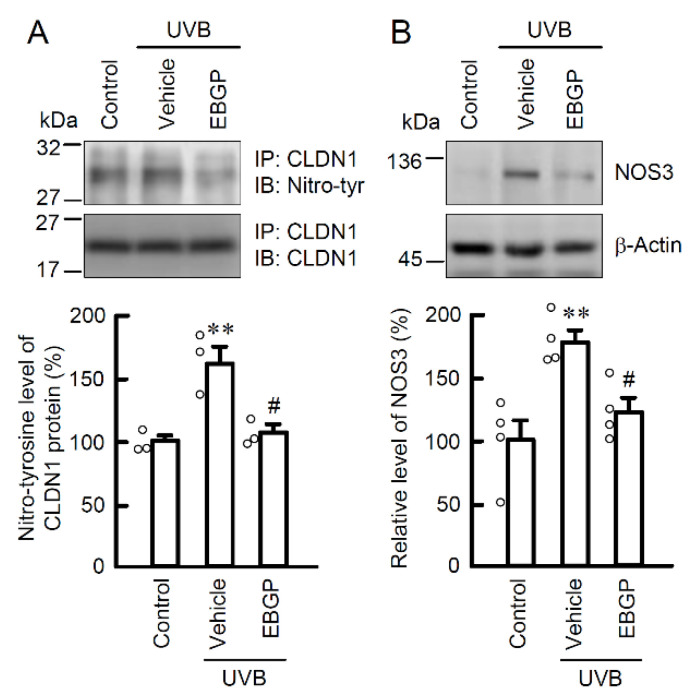
Figure 3.
Effect of EBGP on nitratated-CLDN1 and NOS3 expression in the weak UVB-exposed cells. The cells were incubated in the absence (vehicle) and presence of 10 μg/mL EBGP for 30 min, followed by exposure to 5 mJ/cm2 UVB for 6 h. (A) The cell lysates were immunoprecipitated with anti-CLDN1 antibody. The immunoprecipitants were applied to SDS-PAGE and detected using anti-tyrosine nitration (nitro-tyr) and anti-CLDN1 antibodies. The levels of tyrosine nitration of CLDN1 were represented as a percentage of control. n = 3–4. ** p < 0.01 vs. control. # p < 0.05 vs. vehicle. (B) The cell lysates were applied to SDS-PAGE and detected using anti-NOS3 and anti-β-actin antibodies. β-actin was used as a loading control. The levels of NOS3 expression were represented as a percentage of control. n = 4. ** p < 0.01 vs. control. # p < 0.05 vs. vehicle.

