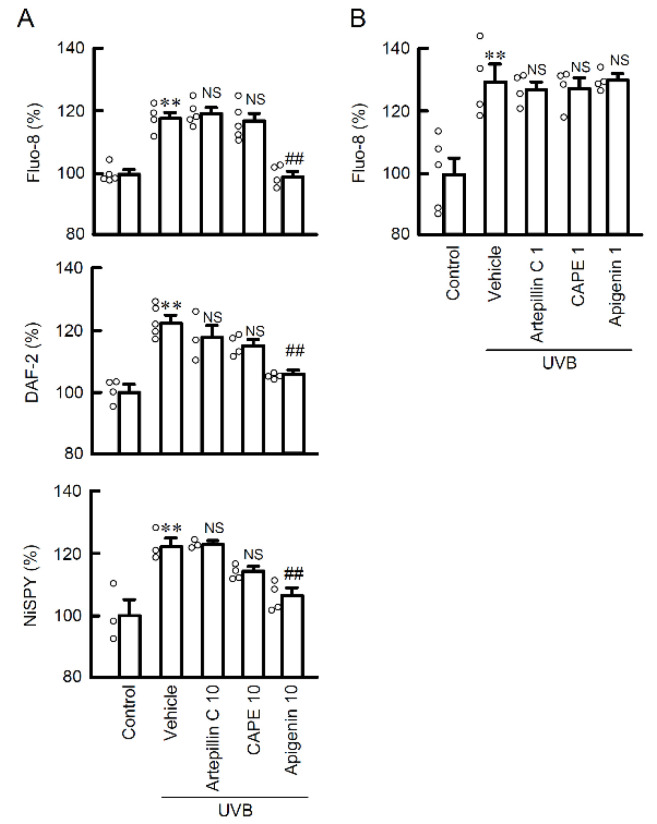
Figure 4.
Effects of propolis components on Ca2+ influx and RNS generations in the weak UVB exposed cells. (A) The cells were incubated in the absence (vehicle) and presence of 10 μM artepillin C, 10 μM CAPE, and 10 μM apigenin for 30 min, followed by exposure to 5 mJ/cm2 UVB for 6 h. After 3 h, the cells were incubated with 5 μM Fluo-8 AM, 5 μM DAF-2DA, or 5 μM NiSPY-3 for 30 min. The fluorescence intensities of Fluo-8, DAF-2, and NiSPY-3 were measured by a microplate reader. (B) The cells were incubated in the absence (vehicle) and presence of 1 μM artepillin C, 1 μM CAPE, and 1 μM apigenin. The data were presented as a percentage of control. n = 3–5. ** p < 0.01 vs. control. ## p < 0.01 and NS p > 0.05 vs. vehicle.

