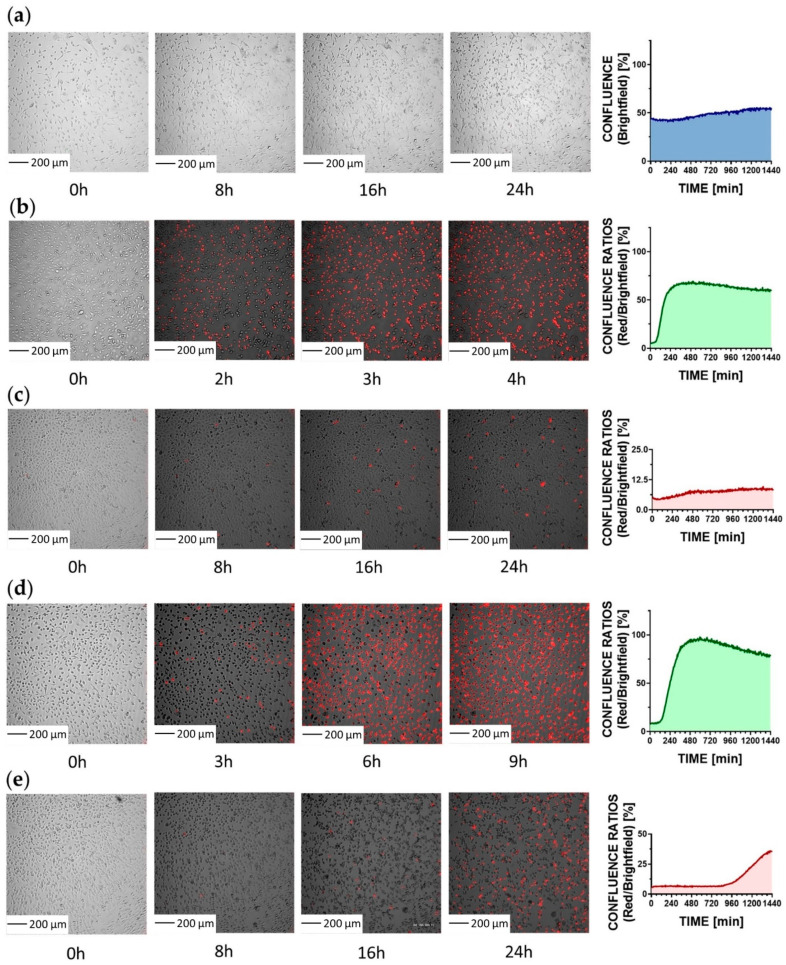
Figure 5.
Real-time fluorescence microscopy. Snapshots are presented with the red channel enabled to visualize late apoptotic/necrotic cells. (a) Control cells snapshots—cells were treated with propidium iodide (PI) and registered with brightfield, green, and red channels enabled. The graph shows the confluence of cells. (b) MDA-MB-231 cells treated with PI and 25 µM curcumin and registered with brightfield, green, and red channels at the same time. The graph shows confluence ratios for red/brightfield channels; (c) MDA-MB-231 treated with PI and 25 µM curcumin and registered with the brightfield and red channels enabled. The graph shows confluence ratios for red/brightfield channels; (d) MDA-MB-231 cells treated with PI and 25 µM compound 5 and registered brightfield, green, and red channels enabled at the same time. The graph shows confluence ratios for red/brightfield channels. (e) MDA-MB-231 treated with PI and 25 µM compound 5 and registered with the brightfield and red channels enabled. The graph shows confluence ratios for red/brightfield.

