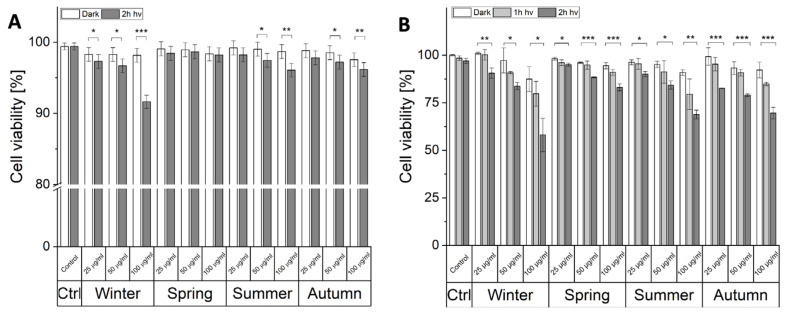
Figure 2.
The photocytotoxicity of ambient particles. Light-induced cytotoxicity of PM2.5 using PI staining (A) and MTT assay (B). Data for MTT assay presented as the percentage of control, non-irradiated HaCaT cells, expressed as means and corresponding SD. Asterisks indicate significant differences obtained using ANOVA with post-hoc Tukey test (* p < 0.05, ** p < 0.01, *** p < 0.001). The viability assays were repeated three times for statistics.

