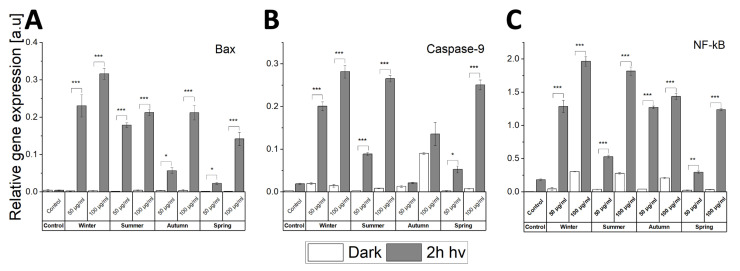
Figure 8.
Relative gene expression of Bax (A), Caspase-9 (B), and NF-κB (C) determined using real-time PCR. HaCaT cells were exposed to PM2.5 (50 or 100 µg/mL) prior to 2 h light irradiation. Cells without ambient particles were used as controls. Data are presented as means ± SD. Asterisks indicate significant differences obtained using ANOVA with post-hoc Tukey test (* p < 0.05, ** p < 0.01, *** p < 0.001). RT-PCR experiments were conducted three times for statistics.

