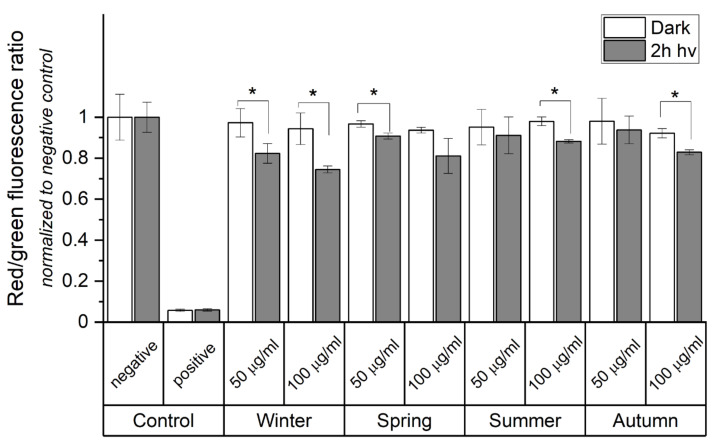
Figure 9.
Change in mitochondrial membrane potential (MMP) determined by JC-10 assay. The diagram shows the quantitative ratio of JC-10 aggregates (red fluorescence) to JC-10 monomers (green fluorescence). Cells were exposed to PM2.5 (50 or 100 µg/mL) prior to 2 h light irradiation. Cells without ambient particles were used as negative controls. Cells incubated with 2% Triton X-100 were used as positive control. Data are normalized to dark, negative control and expressed as means ± SD. Asterisks indicate significant differences obtained using ANOVA with post-hoc Tukey test (* p < 0.05). JC-10 assay was repeated 3 times for statistics.

