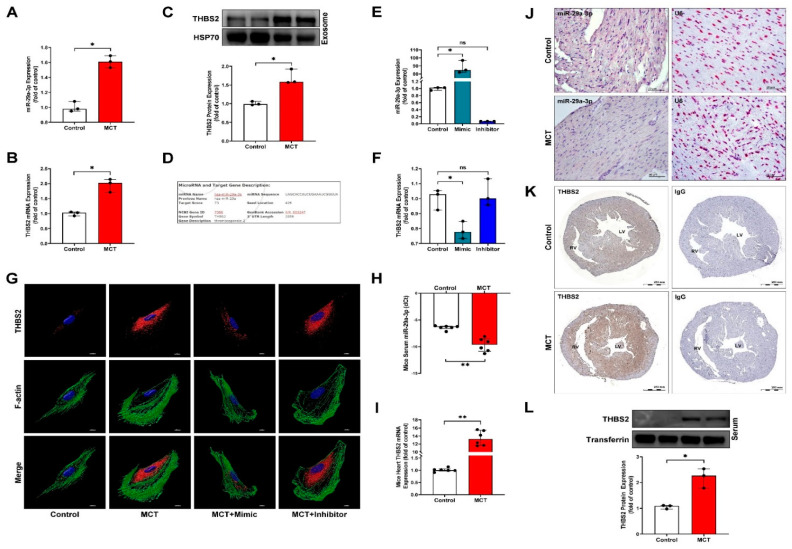
Figure 5.
miR-29a-3p regulates THBS2 expression in vitro and in vivo. (A,B) MCT-induced expression of miR-29a-3p and exosomal THBS2 mRNA, determined by real-time PCR. (C) THBS2 expression in MCT-treated HCM-secreted exosomes determined by western blotting. HSP70 was used as the internal control for exosomal proteins. (D) Alignment of the miR-29a-3p with the THBS2 3′-untranslated region, showing the putative binding sites. (E) Real-time PCR analysis of miR-29a-3p expression in HCMs after transfection with an miR-29a-3p mimic or inhibitor. Data are representative of three independent experiments (n = 3), and values are expressed as median and interquartile range. Mann–Whitney U-test was used to compare two independent groups (* p < 0.05). (F,G) After transfection, THBS2 expression was analyzed by real-time PCR and immunocytochemical staining. Data are representative of three independent experiments (n = 3), and values are expressed as median and interquartile range. Kruskal–Wallis test was used to compare two independent groups (* p < 0.05). (H,I) MCT-induced expression of miR-29a-3p and THBS2 mRNA, determined by real-time PCR. Mann–Whitney U-test was used to compare two independent groups (** p < 0.01). (J) In situ hybridization (ISH) of miR-29a-3p expression (pink color) in myocardial tissues of MCT-induced PAH mice. U6, miRNA internal control. (K,L) THBS2 expression in myocardial tissues and circulating serum of MCT-induced PAH mice were examined by immunohistochemistry and western blotting, respectively. Transferrin was used as the internal control. Data are representative of three independent experiments (n = 3), and values are expressed as median and interquartile range. Mann–Whitney U-test was used to compare two independent groups (* p < 0.05 and ** p < 0.01).

