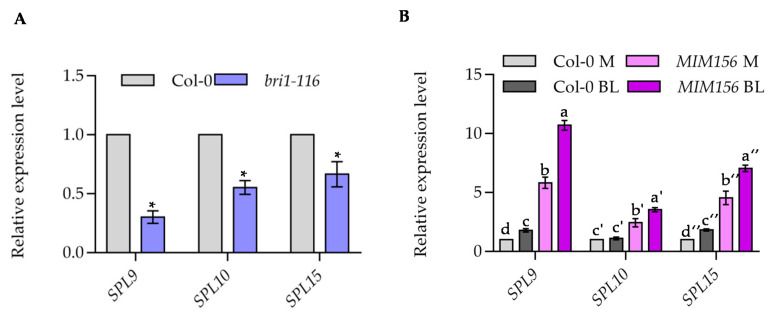
Figure 6.
BR induces the expression of SPL9, SPL10 and SPL15. (A) Quantitative RT-PCR analysis the expression of SPL9, SPL10 and SPL15 in wild type and bri1-116 mutants. Seedlings of Col-0 and bri1-116 were grown on ½ MS medium under constant light for 7 days. PP2A gene was analyzed as an internal control. Error bars represent standard deviation of three independent experiments. Asterisk between bars indicated statistically significant differences between the samples (Student t test, * p < 0.05). (B) BR increased the transcript of SPL9, SPL10 and SPL15. Seedlings of wild type and MIM156 were grown on ½ MS medium for 7 days, and then treated with 100 nM BL for 3 h. PP2A gene was analyzed as an internal control. Error bars represent standard deviation of three independent experiments. Different letters above the bars indicated statistically significant differences between the samples (ANOVA analysis followed by Uncorrected Fisher’s LSD multiple comparisons test, p < 0.05).

