Figure 3.
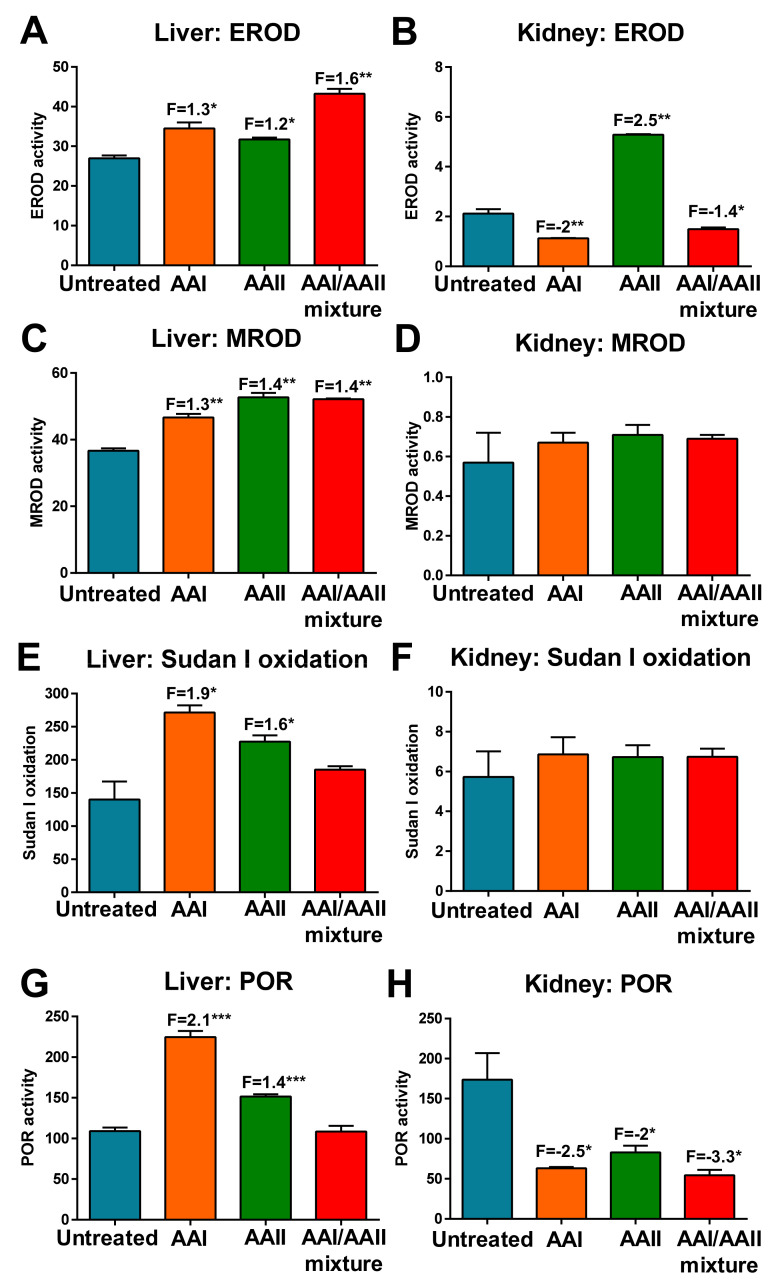
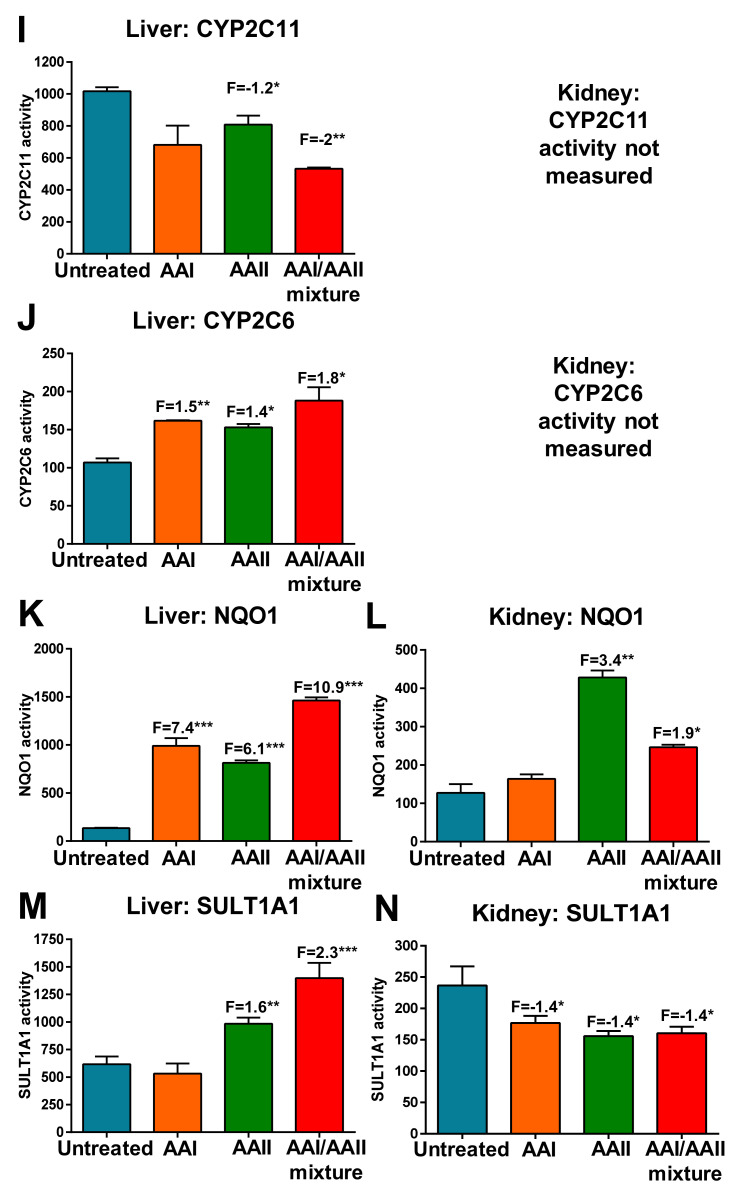
Measurement of enzyme activity levels in microsomal and cytosolic fractions of livers (left panels) and kidneys (right panels) from control (untreated) rats and rats treated with AAI, AAII, or AAI/AAII mixture. CYP1A enzymatic activity in microsomal fractions as measured by EROD activity (picomoles resorufin per minute per milligram protein) (A,B), MROD activity (picomoles resorufin per minute per milligram protein) (C,D) or Sudan I oxidation (picomole total C-hydroxylated metabolites per minute per milligram protein) (E,F). POR enzyme activity was measured as nmol of cytochrome c/mg/minute (G,H). CYP2C11 enzyme activity was measured as testosterone 16α-hydroxylation (picomoles 16α-hydroxytestosterone per minute per milligram protein) (I). CYP2C6 enzyme activity was measured as diclofenac 4′-hydroxylation (picomoles 4′-hydroxydiclofenac per minute per milligram protein) (J). CYP2C11 and CYP2C6 activity was only measured in hepatic microsomes. NQO1 enzyme activity was determined using menadione and cytochrome c as the substrate and expressed as nanomoles cytochrome c/minutes/mg protein (K,L). SULT1A1 enzyme activity was determined using a colorimetric assay with p-nitrophenol sulfate as the sulfo-donor and is expressed as picomoles p-nitrophenol/minute/mg protein (M,N). All values are given as the means ± SD (n = 3). Numbers above columns (‘F’) indicate fold changes in enzyme activity levels compared to control (untreated). Comparison was performed by t-test analysis: * p < 0.05, ** p < 0.01, *** p < 0.001, differences from control. Note different scaling when comparing enzymatic activity levels in hepatic and renal microsomal or cytosolic fractions.


