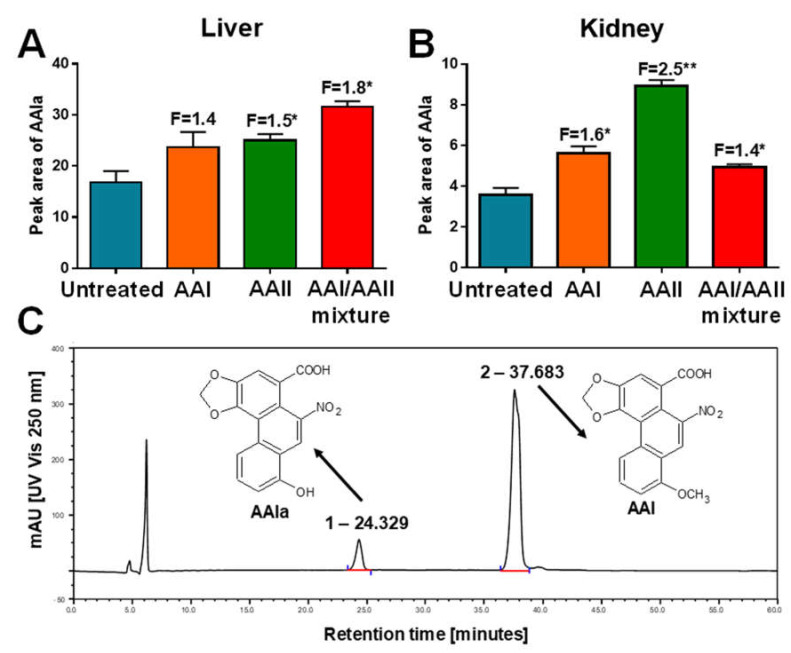
Figure 4.
Oxidation of AAI to AAIa by microsomes of livers (A) and kidneys (B) from control (untreated) rats and rats pre-treated with AAI, AAII, or AAI/AAII mixture. All values are given as the means ± SD (n = 3). Numbers above columns (‘F’) indicate fold changes in AAIa levels compared to control (untreated). Comparison was performed by t-test analysis: * p < 0.05, ** p < 0.01, differences from control (untreated). Representative HPLC chromatographs of AAIa metabolite (peak r.t. at 24.3 min) and AAI (peak r.t. at 37.7 min) produced by rat microsomes incubated with AAI and NADPH (C). The peaks with the characteristic AAI metabolite (AAIa) and the parent AAI are indicated in the chromatograms.

