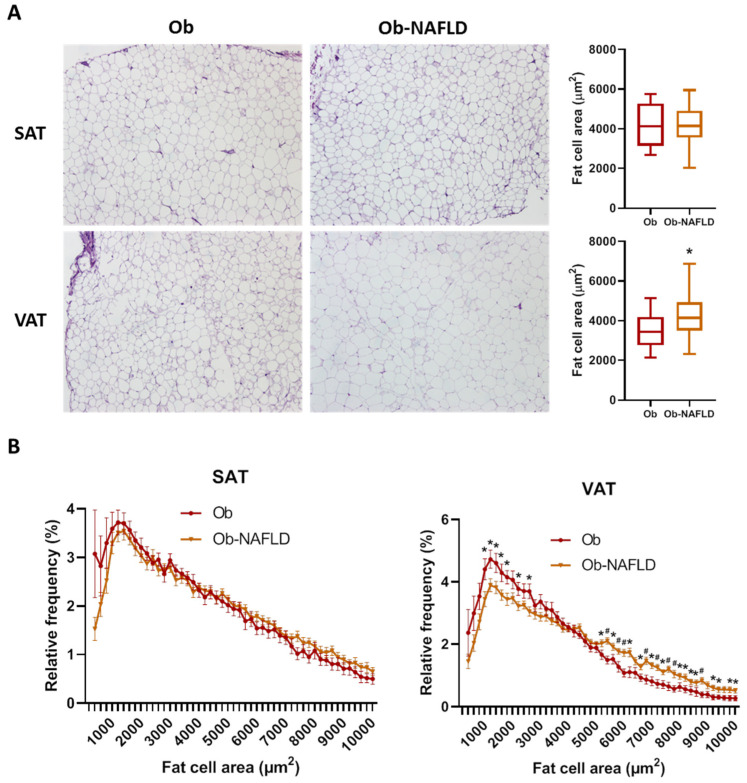
Figure 1.
Fat cell size distribution. (A) Comparison of adipocyte mean cell surface area and representative images of SAT and VAT samples from Ob and Ob-NAFLD individuals. (B) Frequency distribution analysis of fat cell areas divided by size into bin intervals of 200 µm2. Data are presented as mean ± SD frequencies of cells within each bin and compared by Mann-Whitney U test. SAT, subcutaneous adipose tissue; VAT, visceral adipose tissue. * = p < 0.05, # = p < 0.01.

