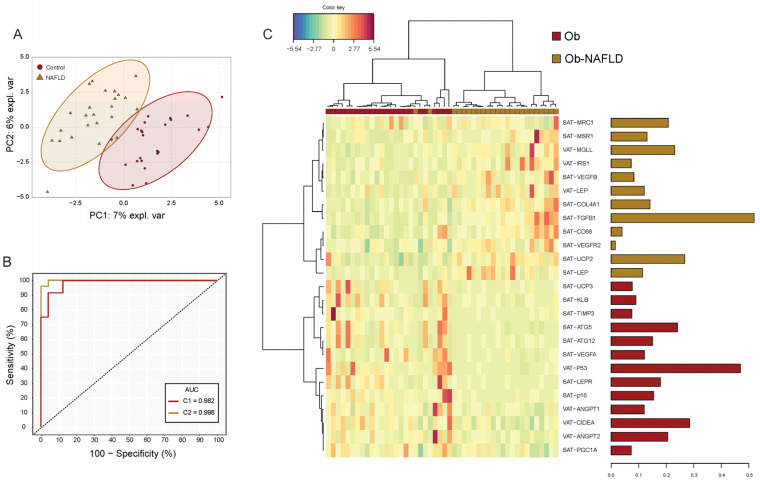
Figure 2.
Subcutaneous and visceral fat gene expression signature model for NAFLD. (A) Sparse partial least square discriminant analysis (sPLSDA) individual scatter score plot (X-axis: component 1 = 25 genes; Y-axis: component 2 = 25 genes). Ellipses shades indicate 95% CI. (B) Receiver operating characteristic (ROC) analysis of the gene expression signature model. Red line corresponds to the accuracy classification performance of component 1-genes whereas yellow line to the model composed by genes (n = 50) of both components. (C) Hierarchical dendrogram-heatmap of the genes conforming sPLSDA Component 1. Log2 transformation is performed on the mRNA raw values of each gene. Complete linkage clustering method with Euclidean distance are used. The contribution of each gene for the model is represented in the barplot where each bar length corresponds to the loading weight (importance) of each variable. Bar color indicates the group in which the mean gene expression is greater.

