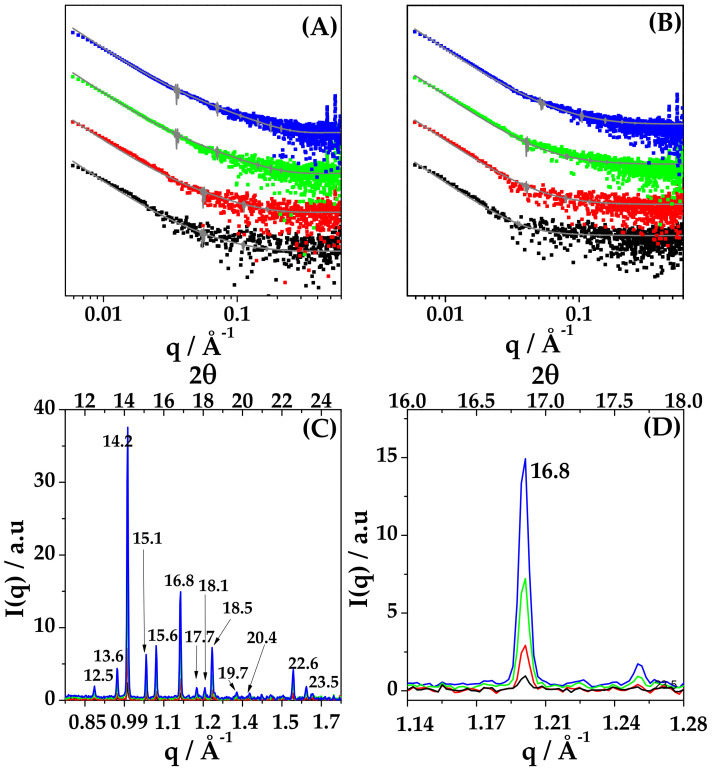
Figure 9.
(A,B). SAXS intensity profiles of the HYA–DEX nanoparticles after subtraction of the intensity contribution of unbound HYA in water (A) and in PB (B). Lines are the fit with a core-shell polydisperse spherical model. Note: the intensity profiles were re-scaled for a better visualization. (C,D) WAXS spectra of HYA–DEX nanoparticles in water in the full q range (C) and in the region of one diffraction peak (D) to better visualize the increase of the intensity with concentration. Labels report the position of peaks expressed in 2θ. HYA–DEX concentration: 1.4 mg/mL (black), 2.8 mg/mL (red), 5.6 mg/mL (green) and 11.2 mg/mL (blue).

