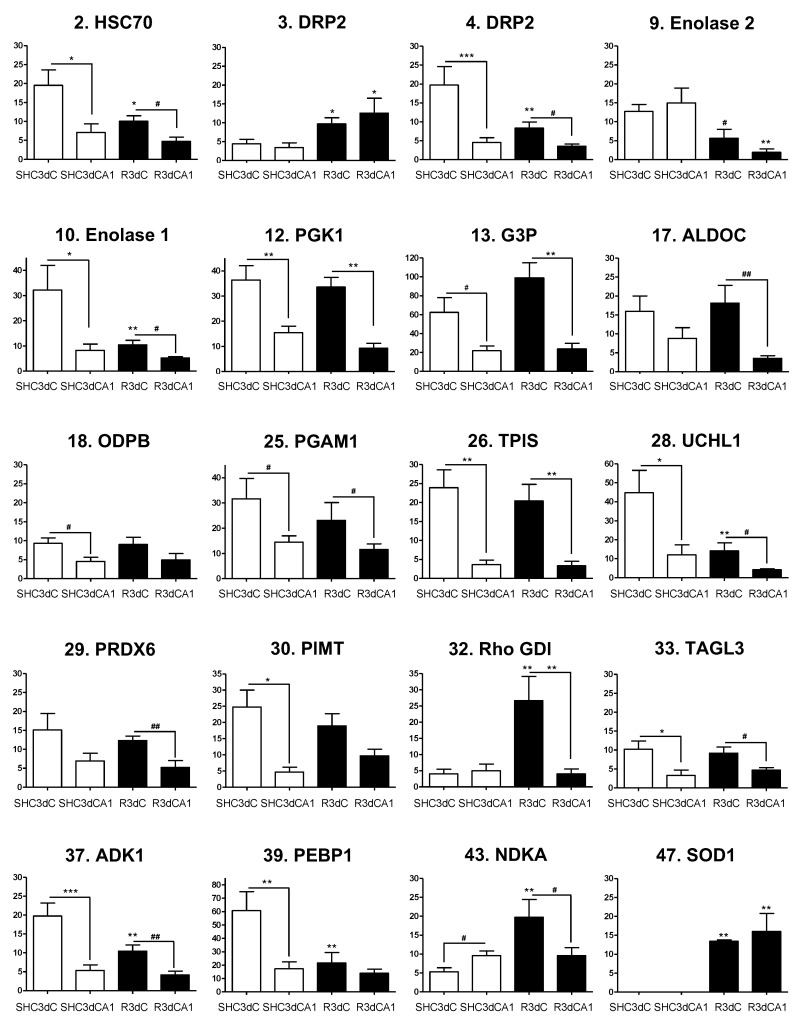
Figure 4.
Levels and statistical analysis of identified 4E-BP2-interacting proteins with significant differential changes. Bar graphs show the 4E-BP2-associated protein levels in control (SHC3d) and ischemic samples (R3d) from the cerebral cortex (SHC3dC and R3dC) and hippocampal CA1 region (SHC3dCA1 and R3dCA1). Data are represented as mean of n = 4 independent samples from 2-D DIGE experiments. Error bars indicate SE. Scheme 0. ** p < 0.01; *** p < 0.001) or by Student’s t-test (# p < 0.05; ## p < 0.01), after significant ANOVA (* p < 0.05), compared with their respective control, or between the cerebral cortex and CA1 samples (indicated by lines). The vertical axis indicates the quantification values of the spot intensity in arbitrary units. Graphs are numbered and named according to the proteins listed in Table 1.

