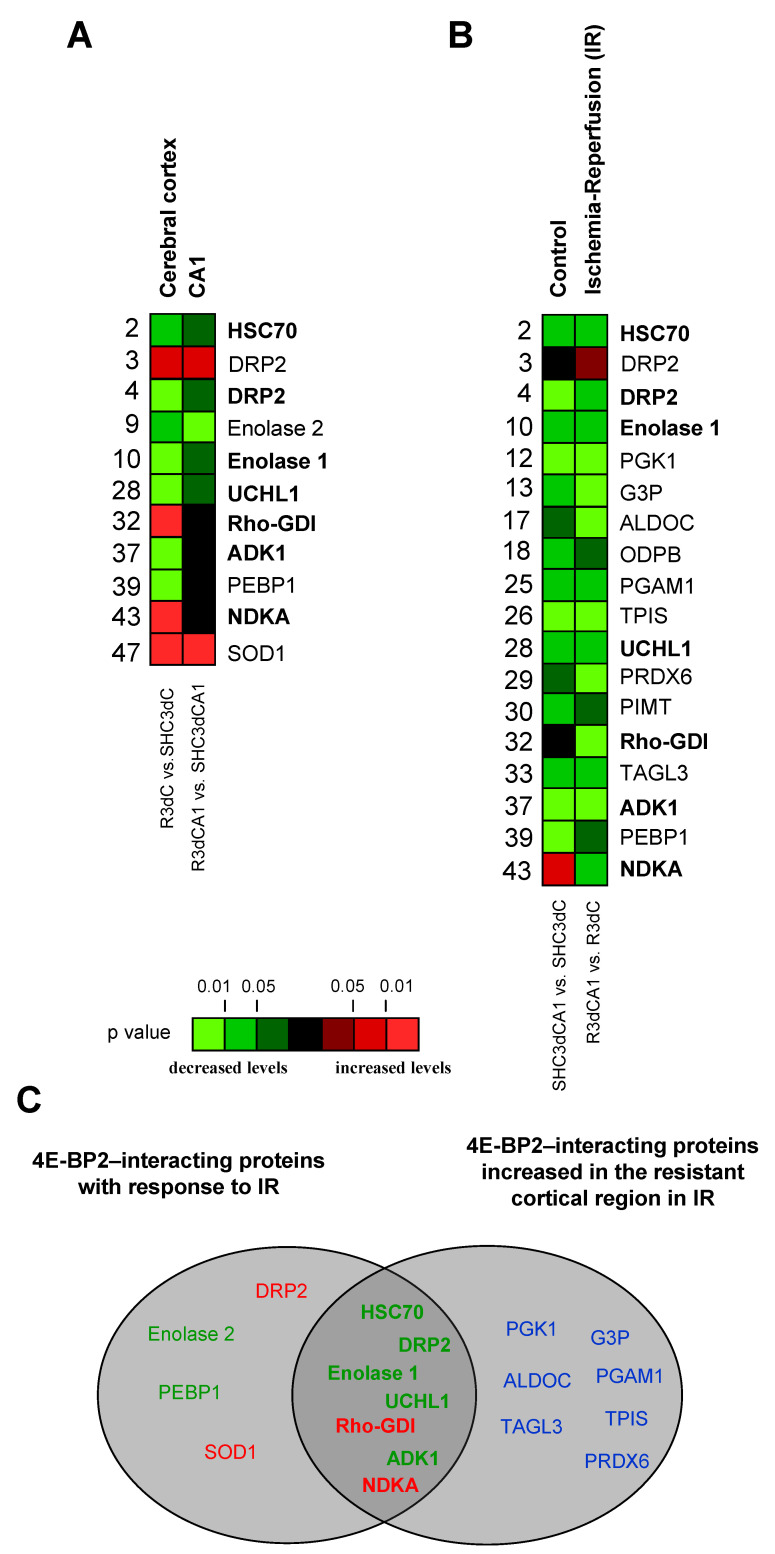
Figure 5.
4E-BP2-interacting proteins with significant differences between the cortical and CA1 regions, in control and ischemic samples. Identified 4E-BP2-interacting proteins were quantified for biological variation analysis and data were compared between the ischemic group and their control condition for the cerebral cortex and CA1 region (R3dC vs. SHC3dC, and R3dCA1 vs. SHC3dCA1, respectively) (A). Other comparisons were done between the vulnerable CA1 region and the cortical resistant region, in both control and ischemia-reperfusion (IR) (SHC3dCA1 vs. SHC3dC, and R3dCA1 vs. R3dC, respectively) (B). Data and statistical analysis were from Figure 4, and color code represents the statistical significance (p value). Proteins marked in bold highlight common proteins with significant changes in R3dC and R3dCA1 ischemic samples (A) and between them (B, right column). (C) Schematic diagram of differentially detected 4E-BP2-interacting proteins in control and ischemic samples. The left diagram includes proteins with increased (red) or decreased (green) association with 4E-BP2 in response to IR stress, as potential ischemia biomarkers. The right diagram includes proteins with significantly lower levels of 4E-BP2 association in CA1 than in the cerebral cortex. The central intersection corresponds to common biomarkers, as potential biomarkers of protection or vulnerability in cerebral ischemia.

