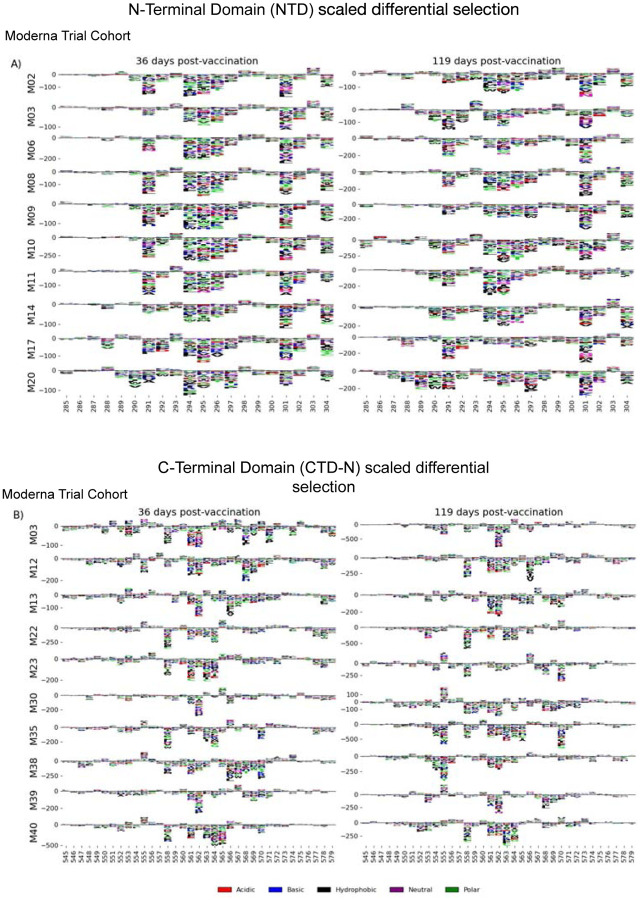
FIGURE 4: NTD and CTD-N epitope escape profiles.
(A and B) Logo plots depicting the effect of mutations on epitope binding in either the NTD (A) or CTD-N (B) epitope for paired samples from the Moderna Trial Cohort. The height of the letters corresponds to the magnitude of the effect of that mutation on epitope binding, i.e. its scaled differential selection value. Letters below zero indicate mutations that cause poorer antibody binding as compared to wild-type peptide, and letters above zero indicate mutations that bind better than the wild-type peptide. Letter colors denote the chemical property of the amino acids. Logo plots on the left and right are paired samples from the same individual, with the participant ID noted on the left.

