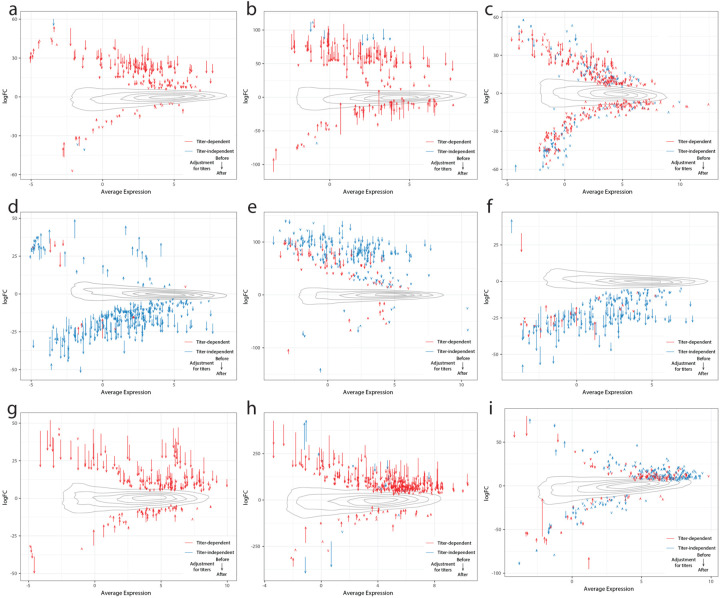
Extended Data Figure 6: Delta-MA plot of anti-spike antibody titer effect on differential expression log2(fold change).
The x and y axes represent the average normalized gene expression and the differential expression log2(fold change) respectively. Each arrow shows a single DEG. The arrow colors indicate the anti-spike antibody titer dependent (red) and independent (blue) DEGs. The contours show the distribution of all log2(fold changes) before controlling for antibody titers. The effect of controlling for antibody titers on DEGs is shown by the arrows, with the arrow tail being the log2(fold change) before adjustment and the arrow head the log2(fold change) after adjustment. a) Sleep problems in plasma cells. b) Nausea/diarrhea/vomiting in plasma cells. c) Smell/taste problems in plasma cells. d) Lung problems in plasma cells. e) Skin rash in plasma cells. f) Pneumonia in plasma cells. g) Anxiety/depression in memory B cells. h) Need Supplemental O2 in M1 macrophages. i) Memory/Thought problems in memory activated CD4+ T cells.

