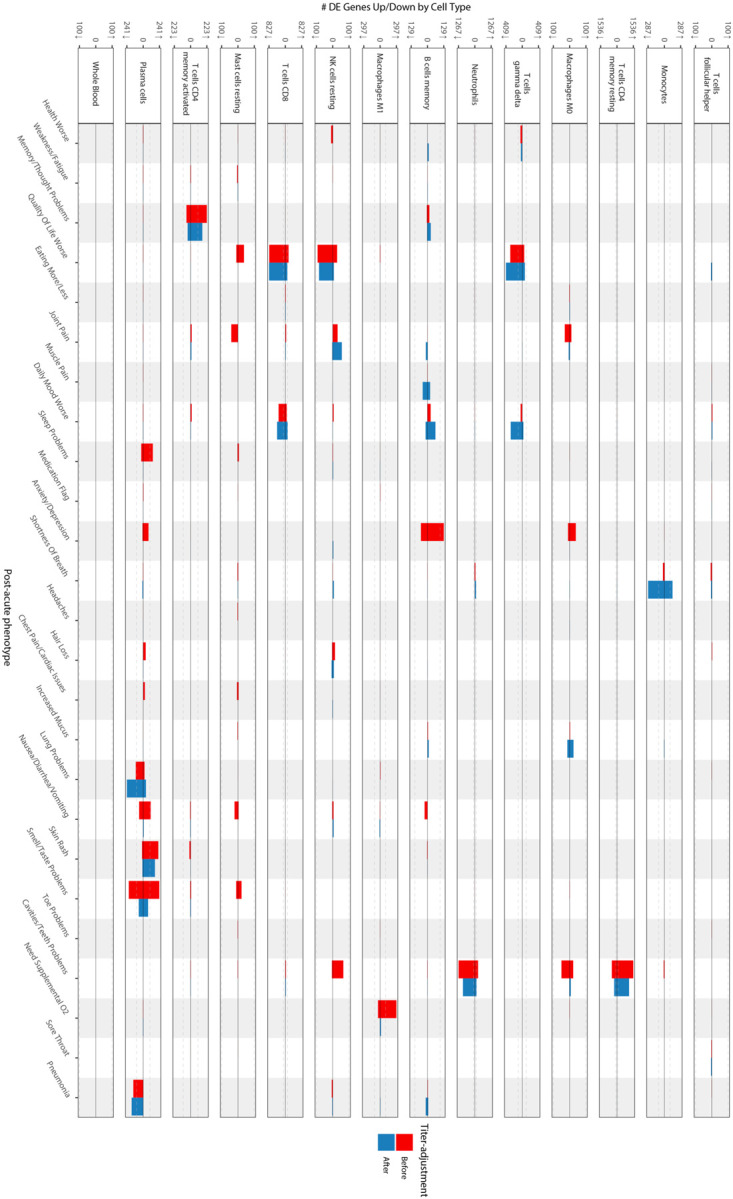
Extended Data Figure 3: Cell-type-specific differential expression for PASC checklist items (full).

The x axes are PASC checklist items and the y axes the number of upregulated (up arrow) and downregulated (down arrow) DEGs at FDR<0.05. Checklist items are arranged in order of descending prevalence. Each facet presents DE results for the indicated cell type. The dashed grey lines indicate the 100 DEG mark. The color of the bars indicates whether the signatures have been adjusted for anti-spike antibody titers.
