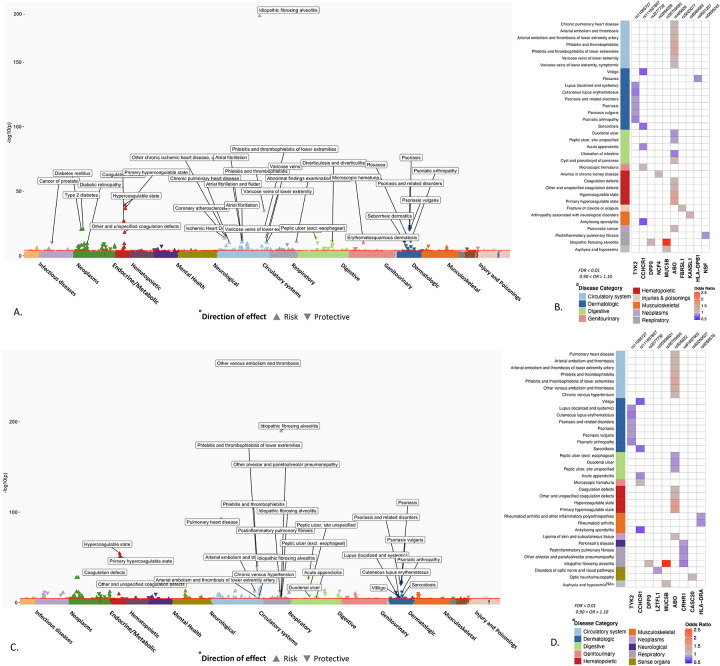
Fig 2.
PheWAS results of candidate SNPs from GWAS of critically ill and hospitalized COVID-19. Significant associations between 48 SNPs from critical ill COVID GWAS (A) and 39 SNPs from hospitalized COVID (C) and EHR derived phenotypes in the Million Veteran Program. The phenotypes are represented on the x-axis and ordered by broader disease categories. The red line denotes the significance threshold using false discovery rate of 1% using the Benjamini-Hochberg procedure. The description of phenotypes is highlighted for the associations with FDR < 0.1 and odds ratio < 0.90 or odds ratio > 1.10. B) and D) A heatmap plot of SNPs with at least one significant association (FDR < 0.1). The direction of effect disease risk is represented by odds ratio. A red color indicates increased risk and blue color indicated reduced risk. The results with odds ratio < 0.90 or odds ratio > 1.10 are shown.

