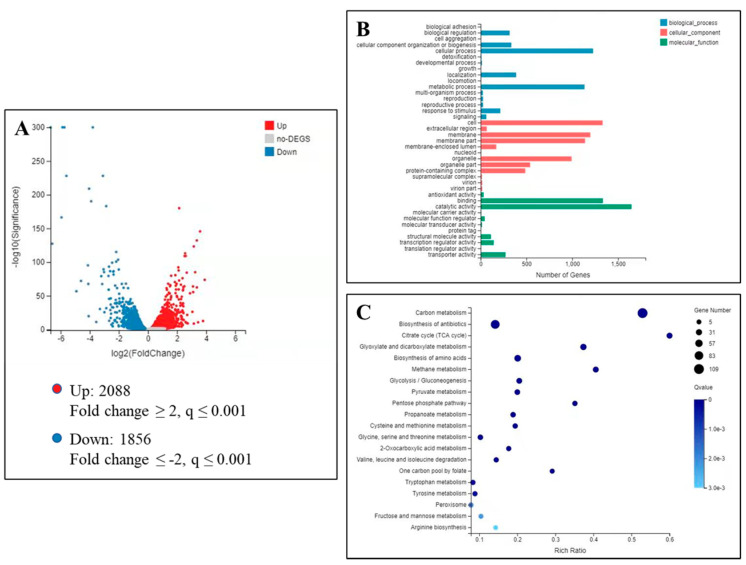
Figure 7.
Transcriptome analysis of the effects of isoxanthohumol on B. cinerea. (A) A volcano plot of the DEGs from control/isoxanthohumol (the X-axis represents value A (log2-transformed mean expression level), the Y-axis represents value M (log2-transformed fold change)); (B) DEG numbers of the most enriched GO terms; (C) KEGG enrichment analysis of DEGs.

