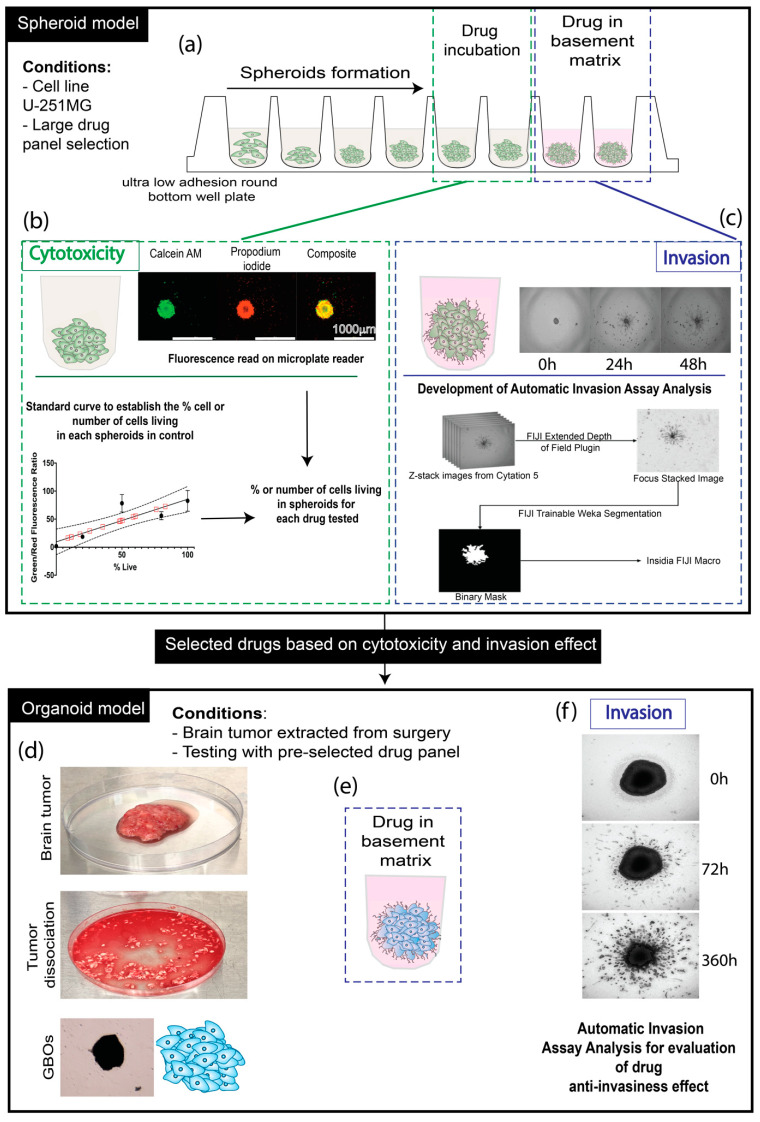
Figure 1.
Schematic of experimentation. (a) U-251 MG cell spheroid formation in an ultra-low attachment round bottom well plate, followed by either drug incubation for cytotoxicity analysis or drug (10 µM) distributed in the basement membrane matrix Matrigel for invasion assay analysis. (b) Cytotoxicity assessment of the compounds on spheroids by interpolation of the standard curve established based on Calcein AM (green: living cells) and propidium iodide (red: dead cells) fluorescence intensity related to the known ratio of living/dead cells (0, 20, 50, 80, and 100%), with the establishment of a standard curve allowing us to interpolate (following mathematical model with Graphpad: Prism) (Figure S2) the percentage of living cells and also the number of cells related to the fluorescence intensity. (c) Development of an automatic invasion assay analysis using FIJI/ImageJ and INSIDIA macro. (d) Brain tumor extracted from surgery, followed by dissection and dissociation to constitute the GBOs. (e) Transfer of the GBOs in an ultra-low adhesion well plate with the drug incorporated in the basement matrix. (f) Evaluation of the invasiveness of the GBOs for 360 h maximum, using automatic invasion assay analysis.

