Figure 3.
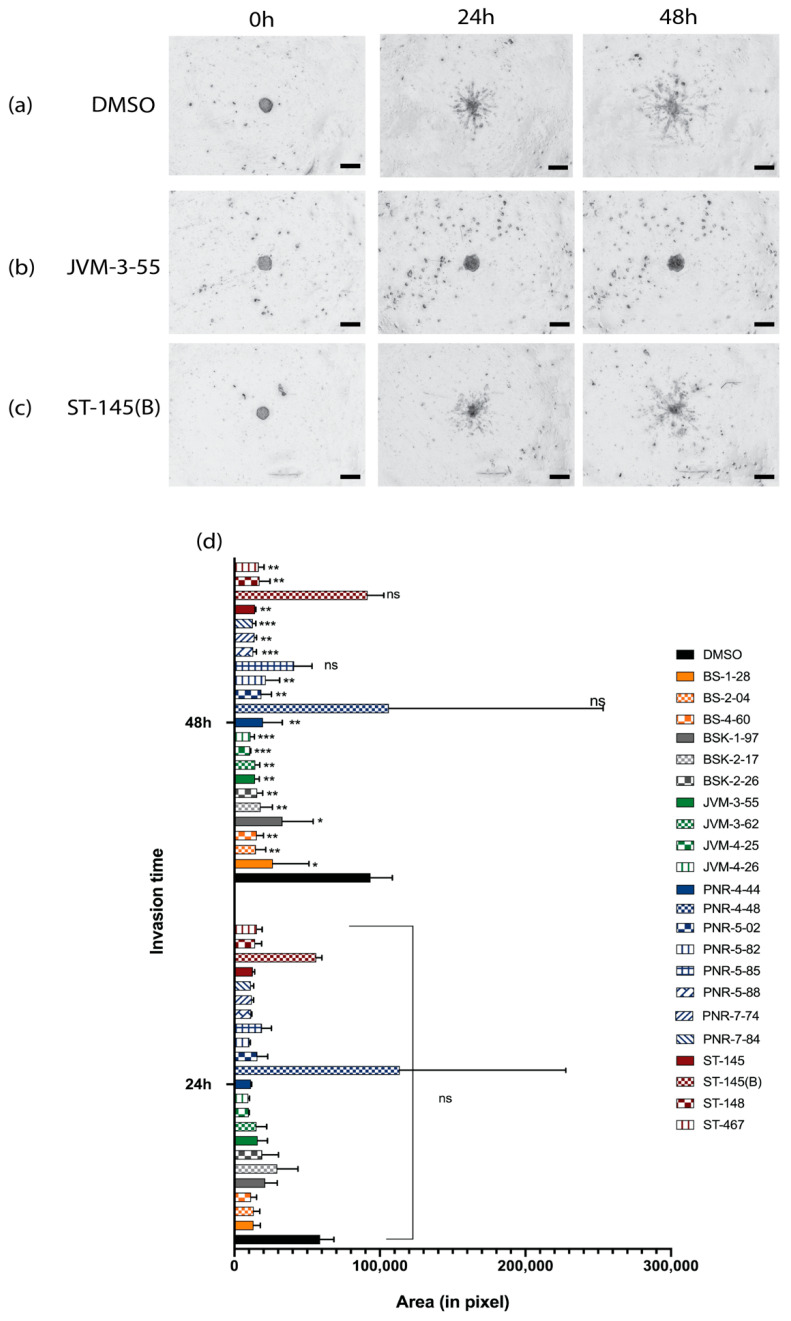
Evaluation of invasion ability and implementation of an automatic invasion analysis assay. Shown are brightfield images recorded on Cytation 5, using a 4× objective lens, overlayed images from z-stack of embedded spheroids in a basement membrane matrix for 0, 24, and 48 h for (a) DMSO, (b) JVM-3-55, and (c) ST-1459(B). Spheroids are large dark bodies in the center of images, and invading cells are smaller dark protrusions from the central spheroid core. (d) Quantitation of invasion was determined by the automatic measurement of the area of cells that invaded the matrix (in pixels) for the different times of incubation (0, 24, and 48 h). Statistical analysis of significance was done using two-way ANOVA with the control (DMSO) for the different times of invasion control as the comparative model with the Dunnett model, ns (non-significant) for adjusted p > 0.05, * for adjusted p ≤ 0.05, ** for adjusted p ≤ 0.01, *** p ≤ 0.001 For each experiment, n = 3. Scale bar: 200 μm, brightfield images were recorded on Cytation 5 using a 4× objective lens.

