Figure 5.
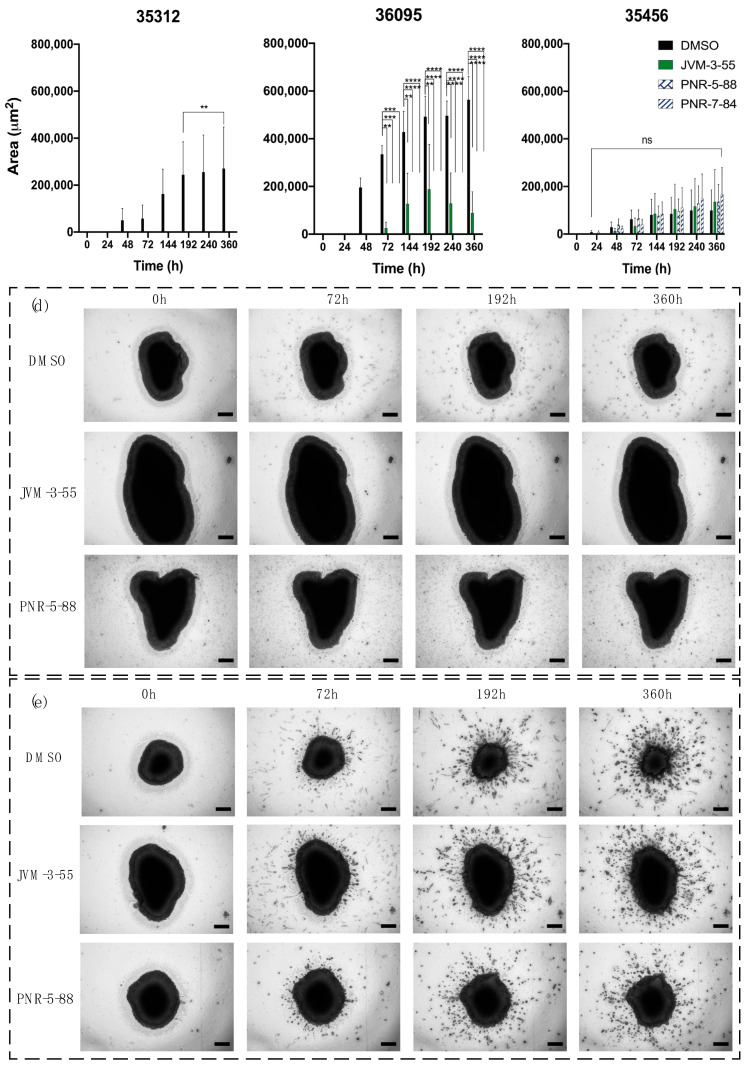
Evaluation of invasion ability of selected compounds on GBOs from different patients. The invasion was determined by automatic measurement of the area of cells invading into the matrix (μm2) in a function of the different times of incubation for patients (a) 35312, (b) 36095, and (c) 35456. The statistical analysis for significance was done using two-way ANOVA with the control (DMSO) for the different times of invasion as the comparative model with the Dunnett model, ns (non -significant) for adjusted p > 0.05,** for adjusted p ≤ 0.01, *** p ≤ 0.001, and **** p ≤ 0.0001. For each experiment, n = 3. Brightfield images were recorded on Cytation 5 using a 4× objective lens, in z-stacks of embedded GBOs in the matrix for 0, 72, 192, and 360 h with either DMSO, JVM-3-55, or PNR-5-88 for patients 36095 (d) and 35456 (e). Scale bar: 200 μm.

