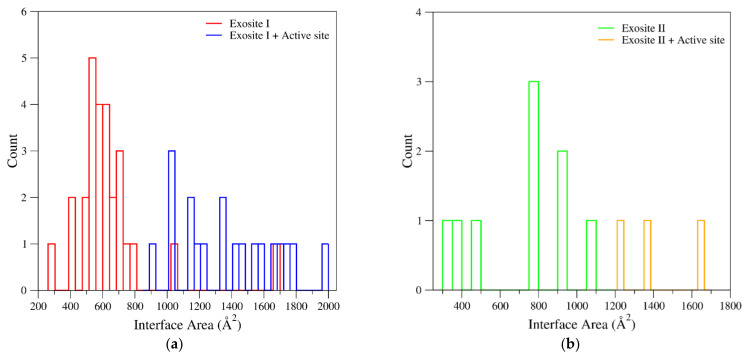
Figure 7.
Distribution of the interface areas found in the thrombin-ligand complexes at (a) exosite I and (b) exosite II. In the panel (a), blue and red bars represent ligands bound either to both exosite I and active site or exclusively to the exosite. Similarly, in the panel (b), orange and green bars represent ligands bound either to both exosite II and active site or exclusively to the exosite. Structures of meizothrombin and prethrombin-2 were not considered. Only ligands corresponding to biomolecules (peptides/proteins, nucleic acids, and heparin-like compounds) bound to thrombin were analyzed. If multiple thrombin-ligand complexes were found in the PDB, the one refined at the highest resolution or the largest fragment was considered.

