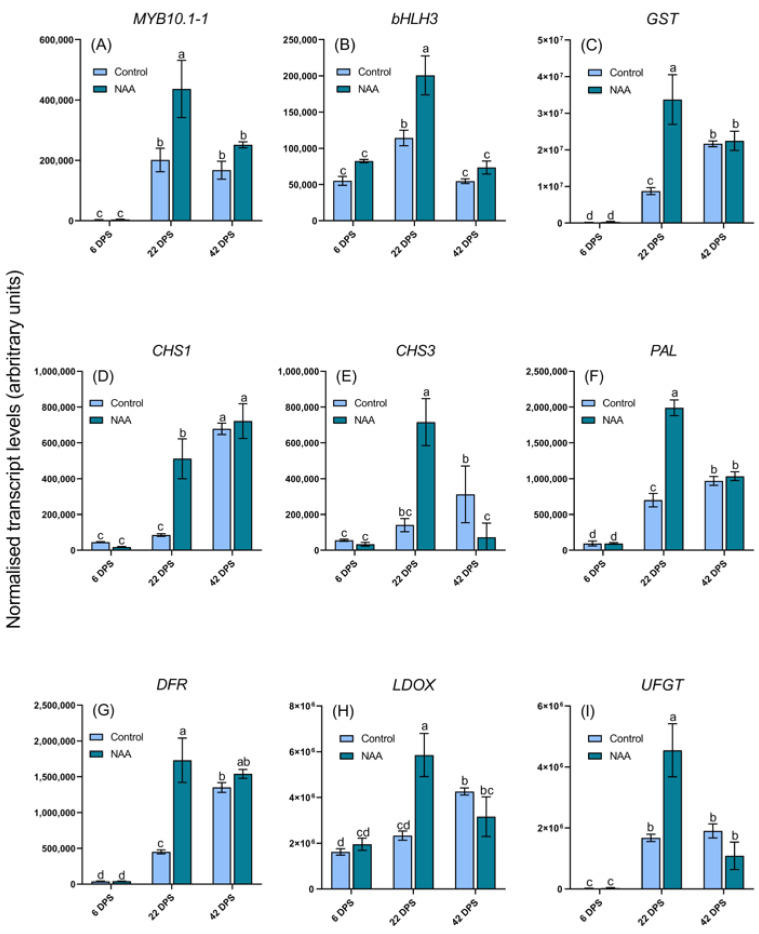
Figure 2.
qRT-PCR analysis of anthocyanin regulatory genes in sweet cherry (Prunus avium L.) fruit at three timepoints after the pre-ripening application of 100 mg/L NAA. (A) MYB10.1-1 p < 0.0001, (B) bHLH3 p < 0.0001 and anthocyanin structural genes (C) GST p < 0.0001, (D) CHS1 p <0.0001, (E) CHS3 p < 0.0001, (F) PAL p < 0.0001, (G) DFR p < 0.0001, (H) LDOX p < 0.0001 and (I) UFGT p < 0.0001. All data represent geometric means ± s. e. (n = 3), bars are denoted by a different letter (a, b, c, d, bc, cd) if the means differ significantly using one-way ANOVA followed by Waller-Duncan’s post hoc test. DPS = days post spray.

