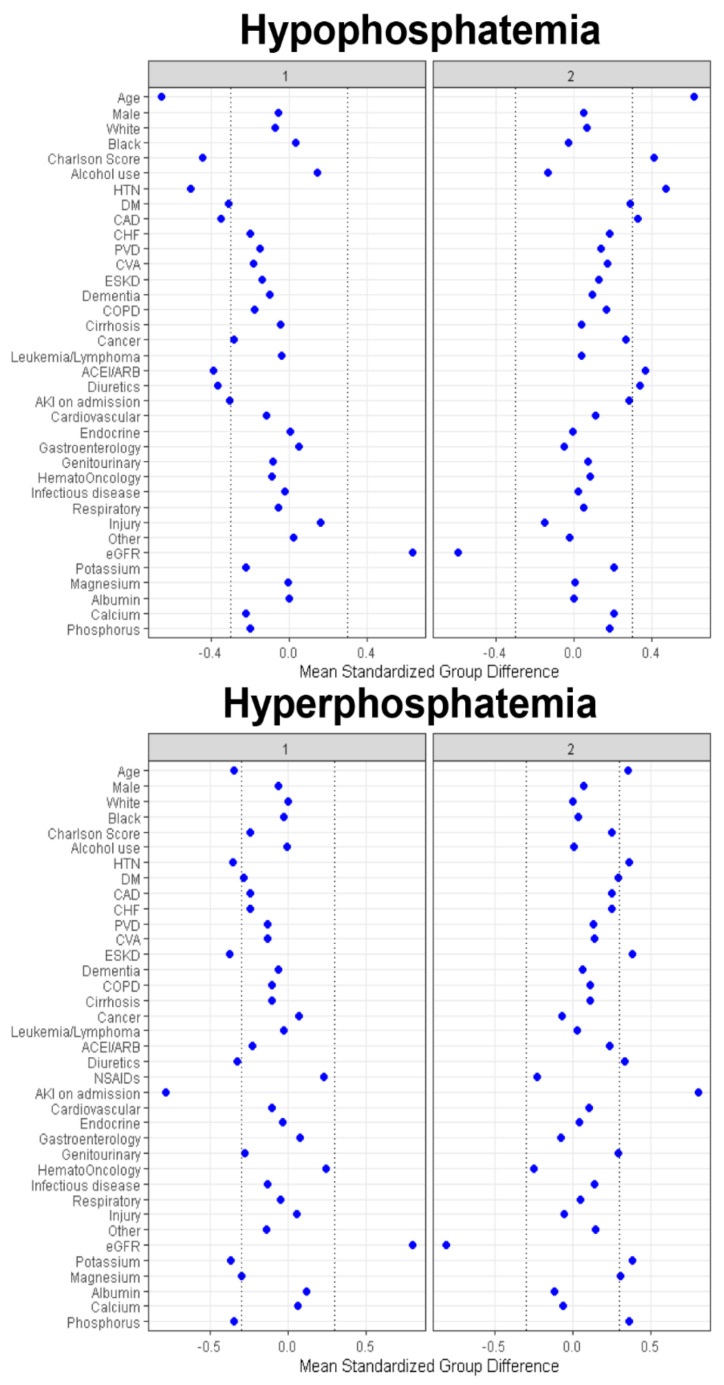
Figure 3.
Standardized mean differences across the two clusters for each baseline variable for patients with hypophosphatemia and hyperphosphatemia. The x axis represents the standardized differences value, and the y axis represents baseline variables. The dashed vertical lines signify the standardized differences values of <−0.3 or >0.3. Abbreviations: AG, anion gap; AKI, acute kidney injury; BMI, body mass index; CHF, congestive heart failure; Cl, chloride; COPD, chronic obstructive pulmonary disease; CVA, cerebrovascular accident; DM, diabetes mellitus; ESKD, end stage kidney disease; GFR, glomerular filtration rate; GI, gastrointestinal; Hb, hemoglobin; HCO3, bicarbonate; K, potassium; ID, infectious disease; MI, myocardial infarction; Na, sodium; PVD, peripheral vascular disease; RS, respiratory system; SID, strong ion difference.

