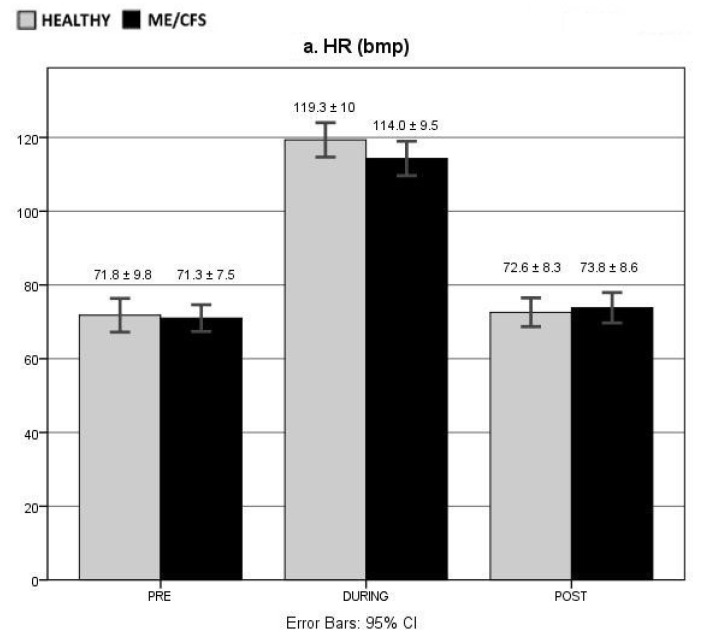
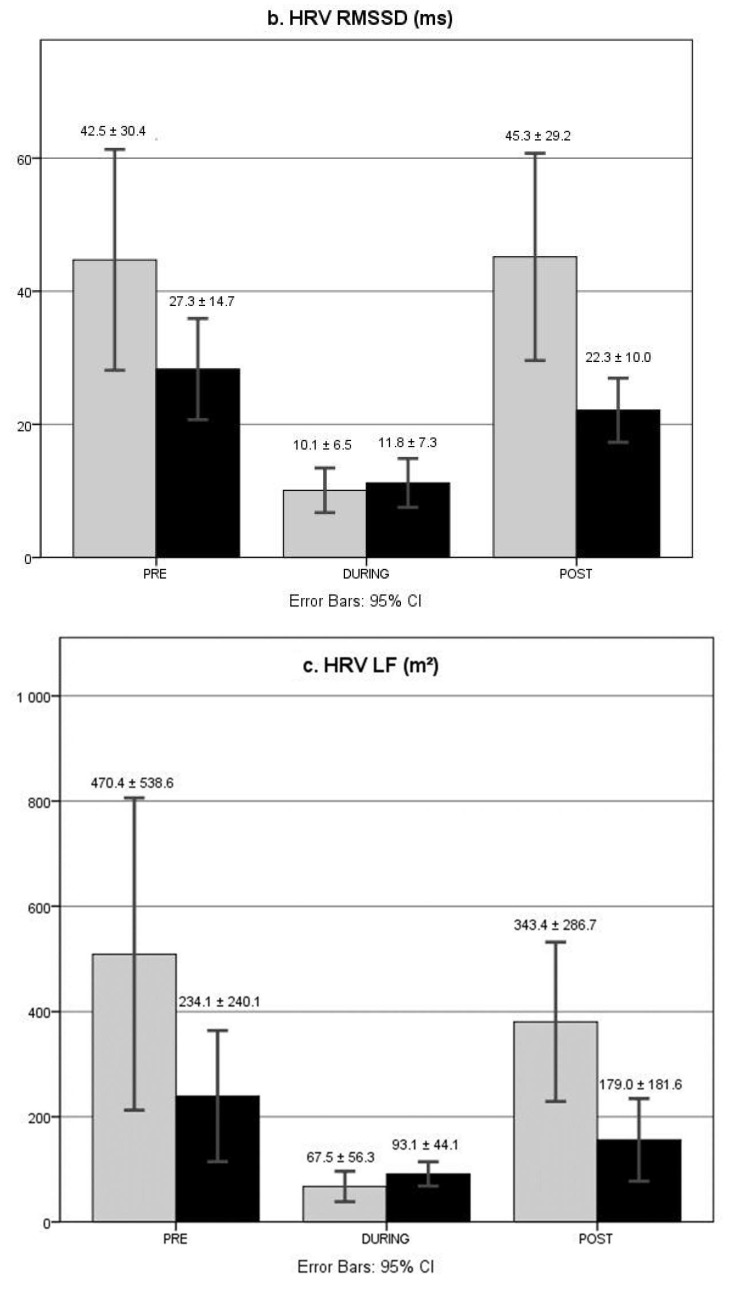
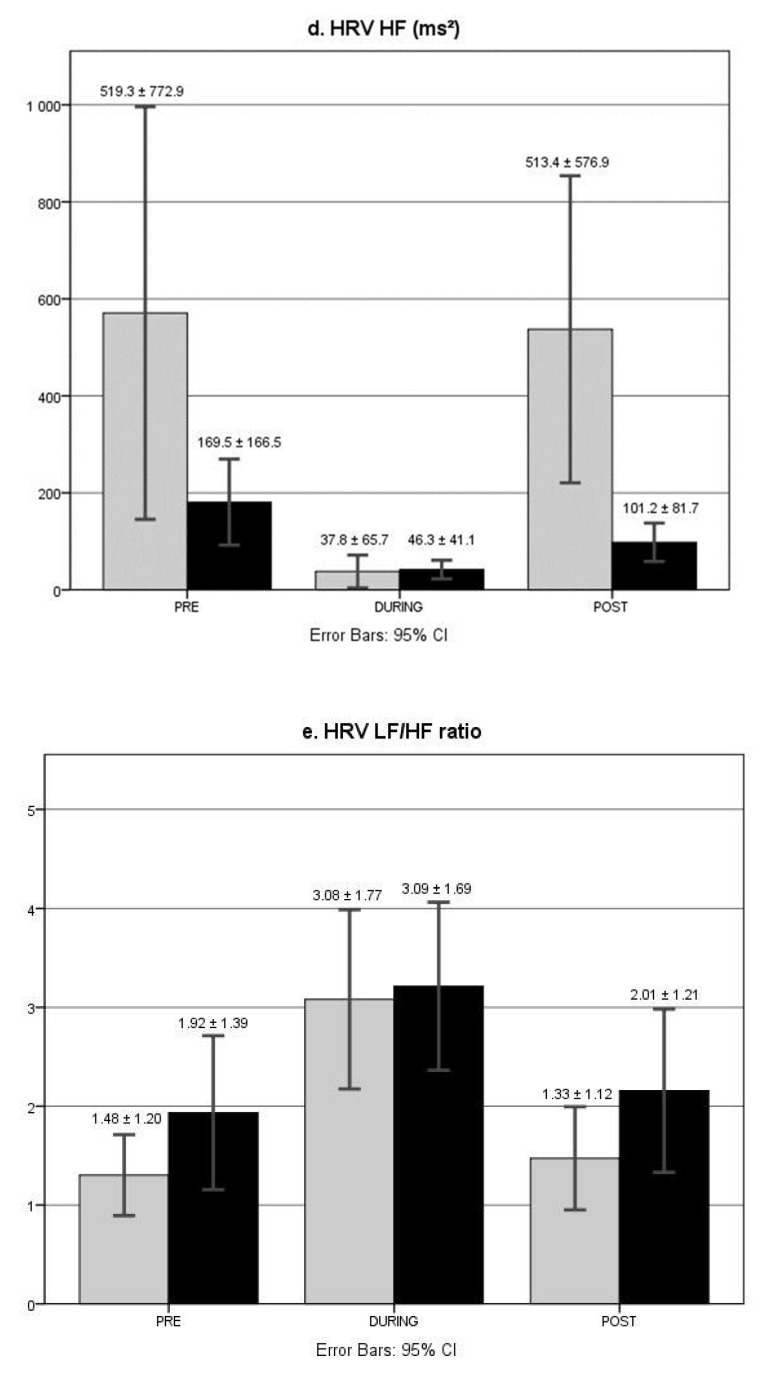
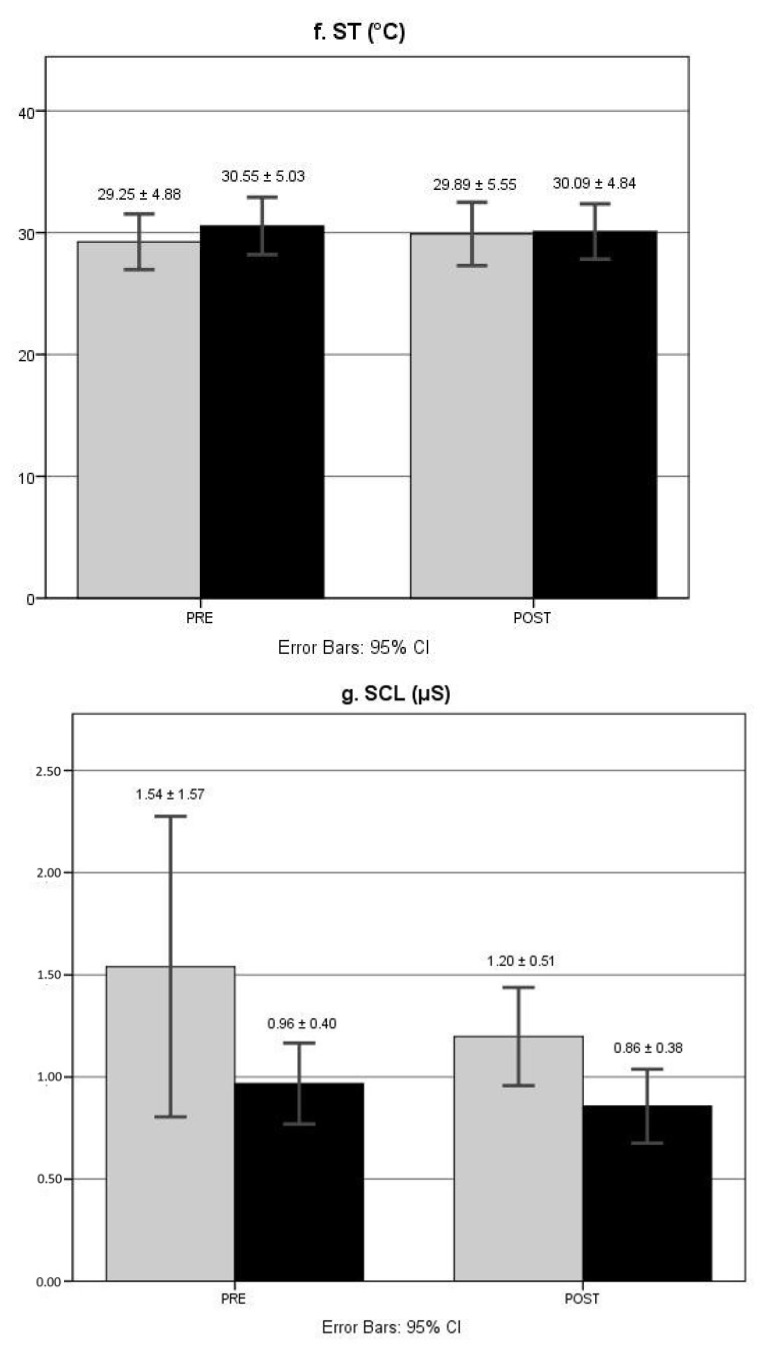
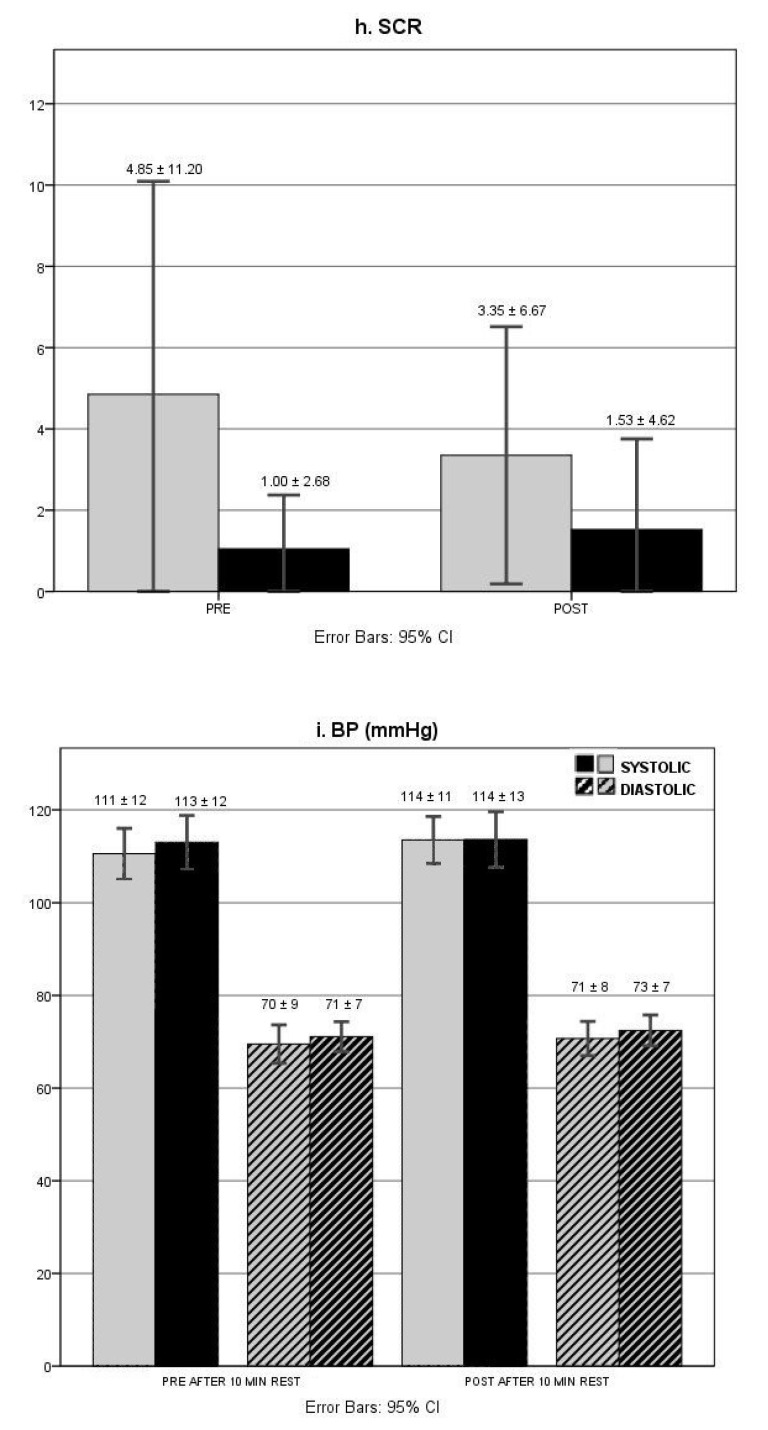
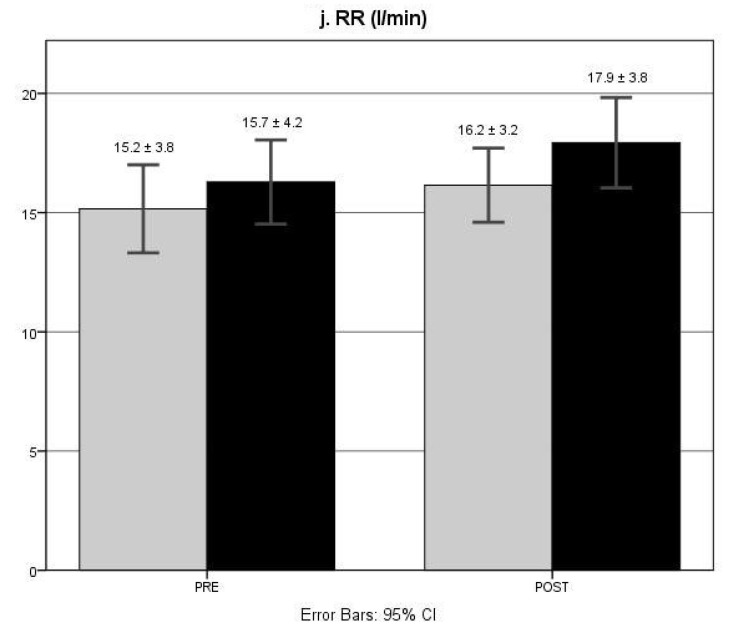
Figure 3.
Means and standard deviations of autonomic outcome measures. The specific outcome measure each figure refers to is in depected in the figure itself. (a) HR (bpm); (b) HRV RMSSD (ms); (c) HRV LF (m2); (d) HRV HF (ms2); (e) The LF/HF ratio; (f) ST (°C); (g) SCL (μS); (h) SCR; (i) PB (mmHg); (j) RR (I/min). Legends: The y-axis represents the quantification of the measure, the x-axis represents the time point of the measure (PRE: measure taken prior to exercise, DURING: measure taken during exercise, POST: measure taken post-exercise). Gray bars: healthy controls, black bars: ME/CFS. Abbreviations: BP: blood pressure, bpm: beat per minute, CI: confidence interval, HR: high frequency, HR: heart rate, HRV: heart rate variability, LF: low frequency, ME/CFS: Myalgic Encephalomyelitis/Chronic Fatigue Syndrome, RMSSD: root mean square of successive differences between NN intervals, RR: respiration rate, SCL: skin conductance level, SCR: skin conductance response, ST: skin temperature.

