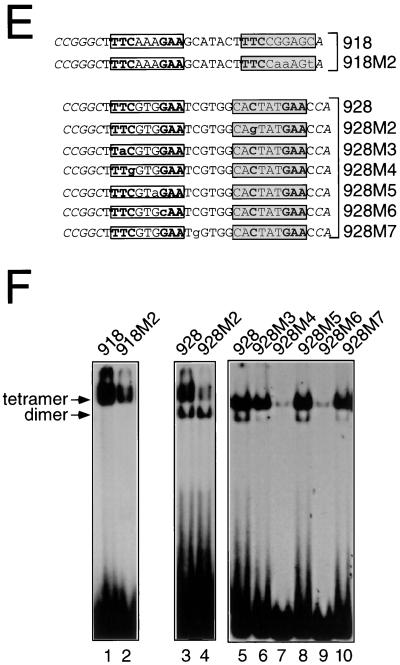
FIG. 10.
Methylation interference analysis of dimeric or tetrameric Stat5a. (A) Oligonucleotide 918 was labeled either on the sense (TOP) or antisense (bottom [BOT]) strand, methylated with dimethyl sulfate, and incubated with Stat5a. Shown are piperidine-mediated cleavages of free probe (F) or of probe bound (B) to a Stat5a tetramer. (B and C), Comparison of the nucleotide contacts between tetrameric or dimeric Stat5a and oligonucleotide 928. The same analysis as in panel A was performed with oligonucleotide 928, either free (F) or bound (B) to a Stat5a tetramer (B) or to a Stat5aW37A dimer (C). Nucleotides which interfered with binding of tetramers but not of dimers are indicated with an arrow. Filled circles indicate strong interference, while asterisks indicate hypermethylation. The artificially introduced flanking nucleotides are in italics. The consensus GAS element is in an open box, while the nonconsensus GAS element is in a shadowed box. (D) Summary of methylation interference analyses shown in panels A, B, and C. (E) Wild-type and mutant forms of oligonucleotides 918 and 928. (F) The oligonucleotides in panel E were labeled by Klenow fill-in and used in EMSAs with 150 ng of Stat5a.


