Figure 5.
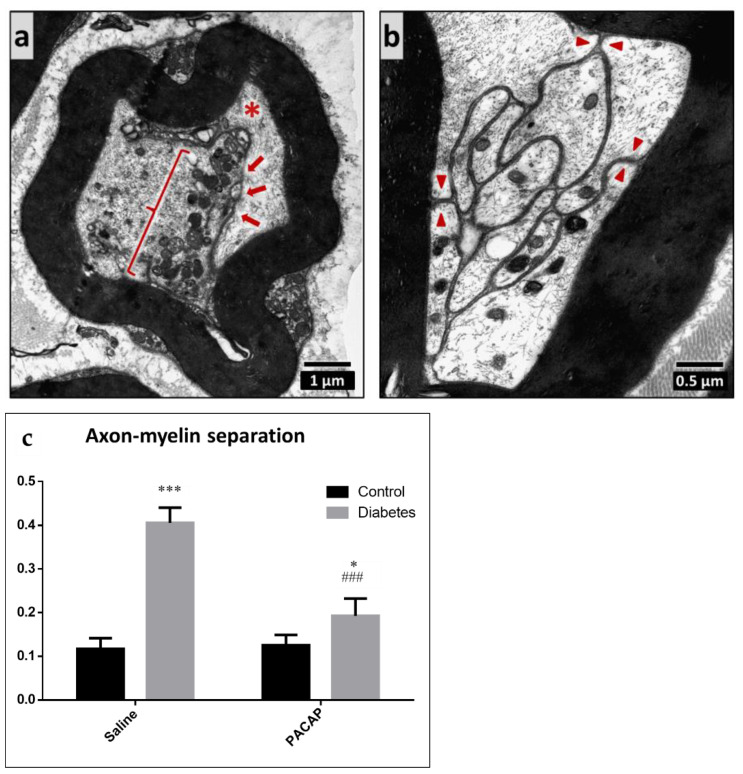
Representative electron microscopic images of axon–myelin separation in myelinated axons. The cell membrane of the Schwann cell is detached from the myelin sheath (arrows) and the axon is dislocated (star) (a). The separated cell membrane of the Schwann cell is visible (arrowheads, (b)). Histogram (c) shows the ratio of the axon–myelin separation in vehicle-treated control, vehicle-treated diabetic, PACAP-treated control, and PACAP-treated diabetic groups. Data are shown as means ± SEM of n = 5/6 rats/group. * p < 0.05, *** p < 0.001 vs. vehicle-treated control; ### p < 0.001 vs. vehicle-treated diabetic group.

