Figure 8.
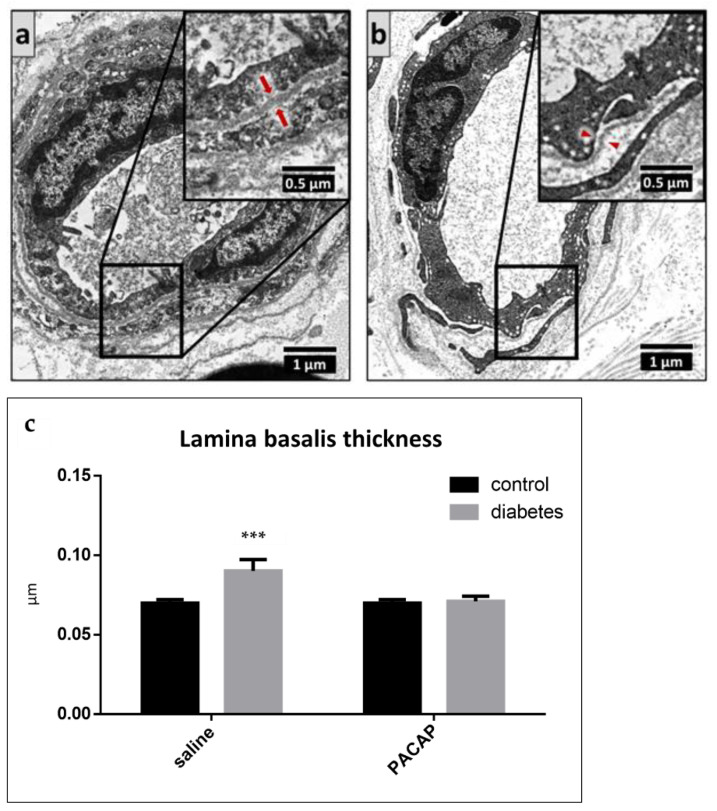
Representative electron microscopic images of the basement membrane of endoneurial capillaries in vehicle-treated diabetic ((a), arrows) and PACAP-treated diabetic ((b), arrowheads) groups. Histogram (c) shows the thickening of the basement membrane of the endoneurial capillaries in vehicle-treated control, PACAP-treated control, vehicle-treated diabetic, and PACAP-treated diabetic groups. Data are shown as means ± SEM of n = 5/6 rats/group, *** p < 0.001 vs. vehicle-treated control groups.

