Figure 7.
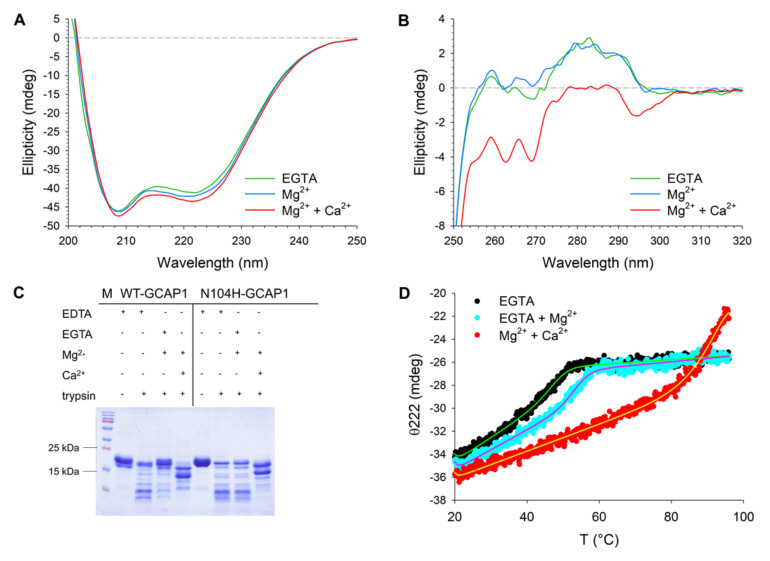
Structural and stability changes occurring in N104H-GCAP1 upon ion binding. (A) Far-UV CD spectra of 15 µM N104H-GCAP1 in the presence of 300 µM EGTA (green) and after serial additions of 1 mM Mg2+ (blue) and 300 µM free Ca2+ (red). (B) Near-UV spectra of ~39 µM N104H-GCAP1 in the presence of 500 µM EGTA (green) and after serial additions of 1 mM Mg2+ (blue) and 500 µM free Ca2+ (red). (C) Limited proteolysis of 20 µM WT and N104H-GCAP1 after 10 min incubation with 0.3 µM trypsin in the presence of 2 mM EDTA, 1 mM EGTA + 1.1 mM Mg2+ or 1 mM Mg2+ and 1 mM Ca2+. Variants in the presence of 2 mM EDTA and in the absence of trypsin represent the reference MW of the undigested protein. (D) Thermal denaturation profiles of 10 µM N104H-GCAP1 in the presence of 300 µM EGTA (black), 300 µM EGTA + 1 mM Mg2+ (blue) or 1 mM Mg2+ + 300 µM Ca2+ (red). CD spectroscopy measurements were carried out in 20 mM Tris-HCl pH 7.5, 150 mM KCl, 1 mM DTT buffer. Thermal denaturation profiles were collected by monitoring the ellipticity at 222 nm in a temperature range spanning from 20 °C to 96 °C and were fitted to a function accounting for thermodynamic contributions (see Methods section).

