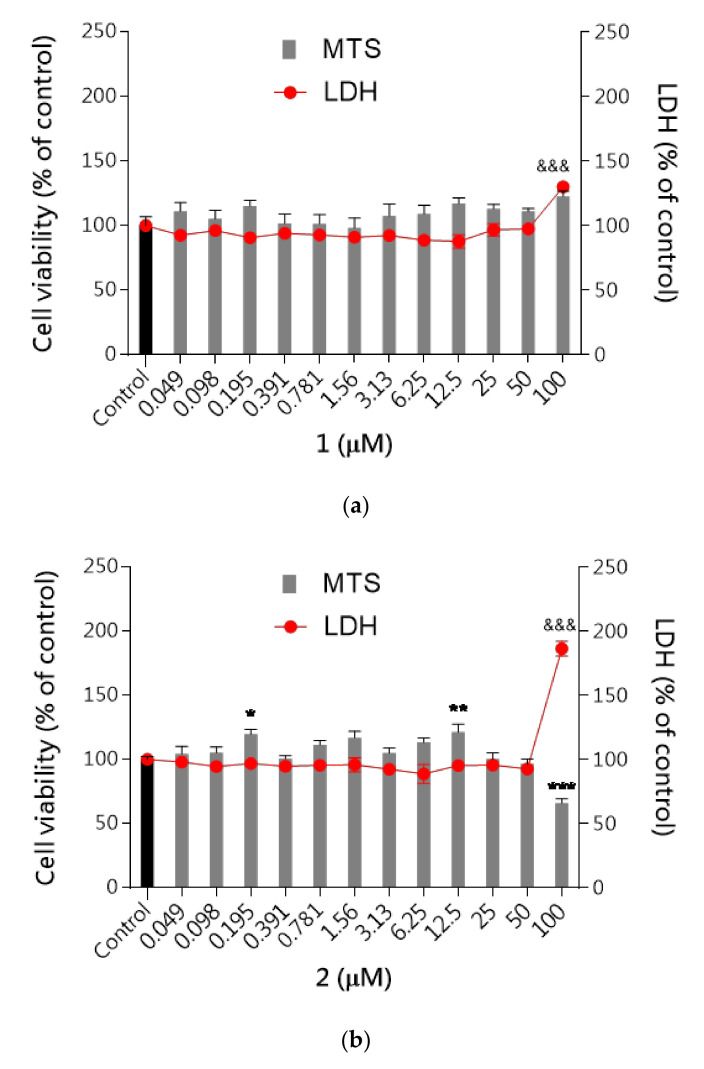
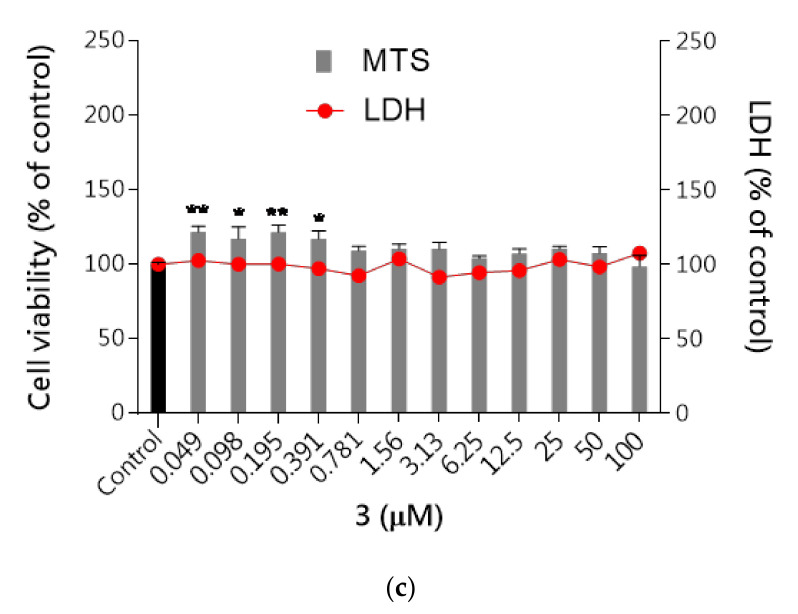
Figure 7.
The effect of tested compounds 1–3 on neuroblastoma cell viability: (a) 1, (b) 2, (c) 3. SH-SY5Y cells were treated with compound 1, 2 or 3 over a wide range of concentrations (0.049–100 μM) for 48 h. Cell viability was measured by MTS assay. Each point (mean ± SEM of two independent experiments, each of which consisted of eight replicates per treatment group) represents absorbance units and is expressed as a percentage of control compared to 0.1% DMSO control cells (set as 100%). Statistical analysis by one-way ANOVA (GraphPad Prism 8) showed significant differences between the groups (p < 0.05) and was followed by the Dunnett’s multiple comparisons test. Data indicated with *** p ≤ 0.001, ** p ≤ 0.01, * p ≤ 0.05, &&& p ≤ 0.001 reflect statistically significant differences between control and experimental groups.


