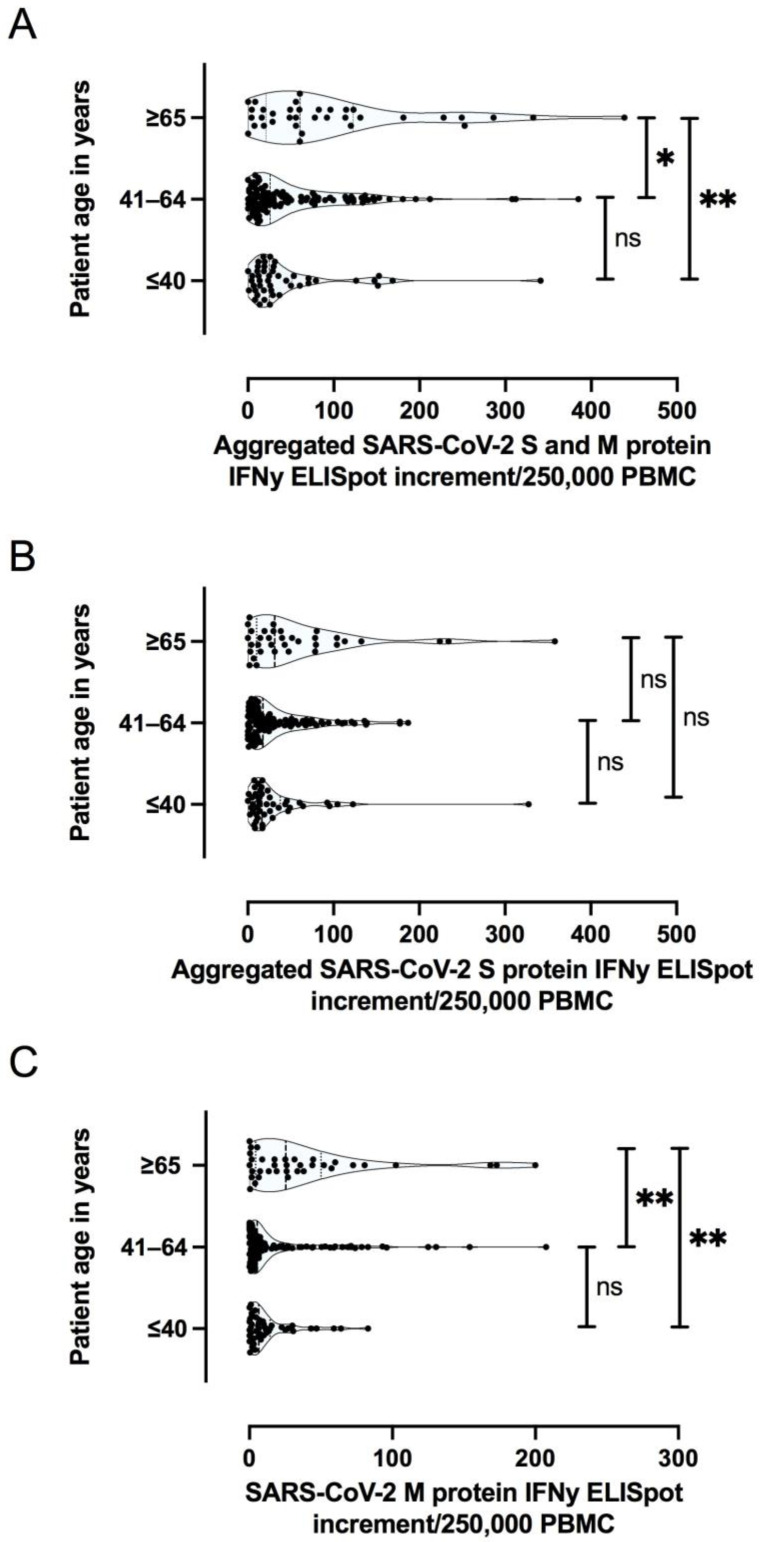
Figure 6.
Aggregated IFNy ELISpot increment for SARS-CoV-2 Spike (S) and Membrane (M) protein specific T cell responses (A), aggregated number of S protein specific T cell responses (B), and M protein specific T cell responses (C), with respect to patient age. ** p < 0.005; * p < 0.05; ns not significant.

