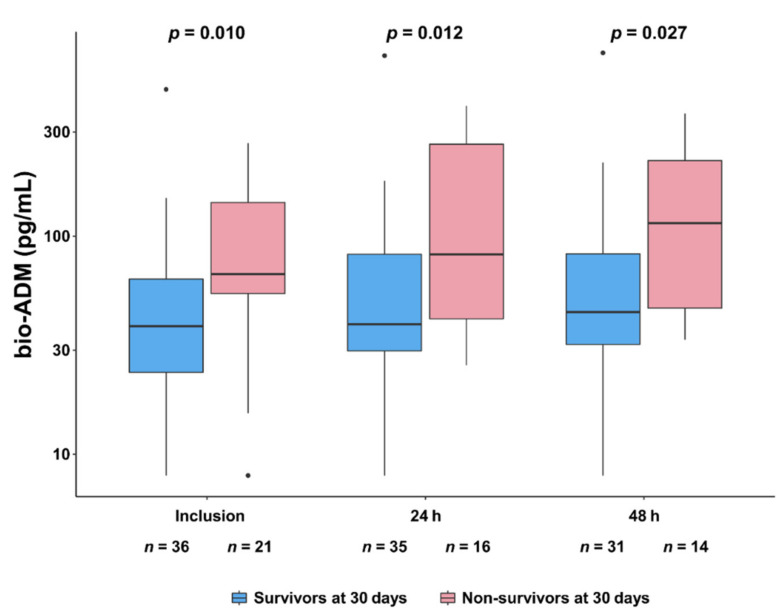
Figure 1.
Comparison of time-course of bio-ADM, from inclusion to 48 h, between 30-day survivors and non-survivors. A base-10 log scale is used for the y-axis. Dots indicate outliers. Comparisons at each time point were performed using the Kruskal–Wallis test comparing bio-ADM values in 30-day survivors vs. 30-day non-survivors.

