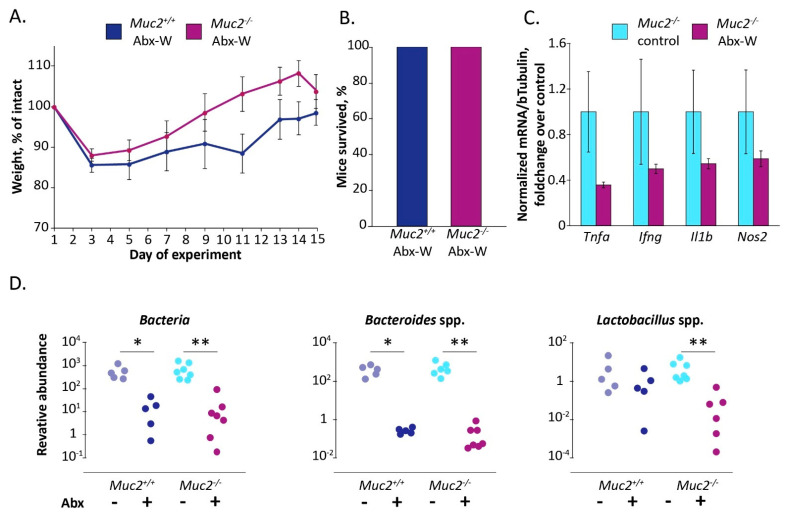
Figure 3.
Muc2−/− mice free of the infections survive after the antibiotic treatment. (A) Body weight dynamics upon antibiotic treatment. (B) Survival rate. (C) Gene expression in colon tissue normalized on beta Tubulin (Tubb5) gene. (D) Relative abundance of the gut bacteria in feces on the day 15, normalized on Mus musculus 28S rRNA gene. *, **—differences between groups p < 0.05, p < 0.01, Mann–Whitney u-test. Experimental groups: “Abx-W”—treatment with the antibiotics by adding in drinking water.

