
Figure 1.
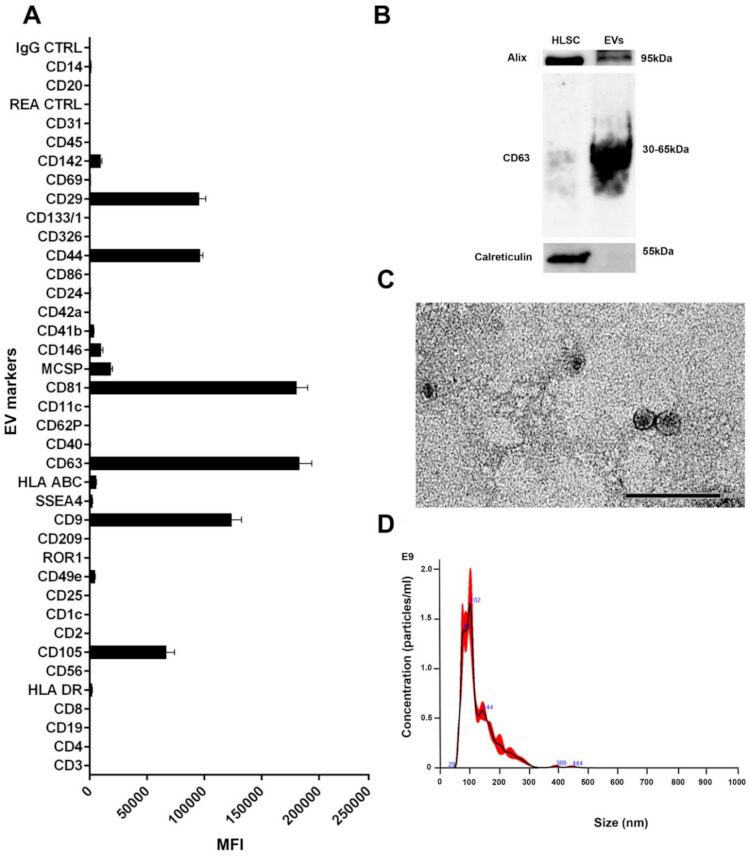
Characterisation of HLSC-EVs. (A) Characterisation of HLSC-EV surface antigens using a multiplex bead-based flow cytometry assay (n = 3 batches of HLSC-EVs, data represents mean ± SD). (B) Western blot analysis of HLSC-EVs displaying classical EV markers. (C) Representative electron microscopic images depicting HLSC-EV morphology (scale bar = 200 nm). (D) Nanoparticle tracking analysis showing the size distribution and concentration of HLSC-EVs.