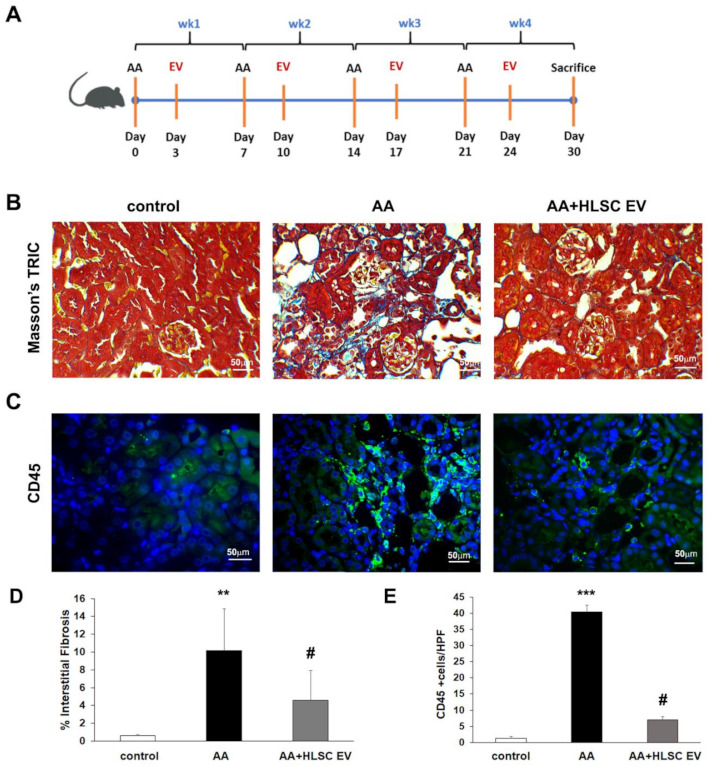
Figure 2.

HLSC-EVs reduces fibrosis and inflammation in AAN. (A) Schematic representation of AAN in vivo model. (B) Representative micrographs of Masson’s trichome stained renal sections showing interstitial fibrosis (blue stain; scale bar = 50 µm). (C) Representative immunofluorescence images showing increased expression of CD45 in AAN mice and downregulation following treatment with HLSC-EVs. (D) Histological quantification of interstitial fibrosis by multiphase image analysis of 10 fields per section. Data represent mean ± SD; one-way ANOVA. ** p < 0.01 AA vs. control, # p < 0.01 AA+HLSC EV vs. AA. (n = 5 mice for control and AA, and n = 9 mice for AA+HLSC EV). (E) Histogram depicting the number of cells positive for CD45 in FFPE sections of in vivo experimental groups. Data represent mean ± SD of the number of cells positive per HPF (high power field) measure from 10 images (n = 5 mice per group). *** p < 0.0001 AA vs. control and # p < 0.01 AA+HLSC EV vs. AA.
