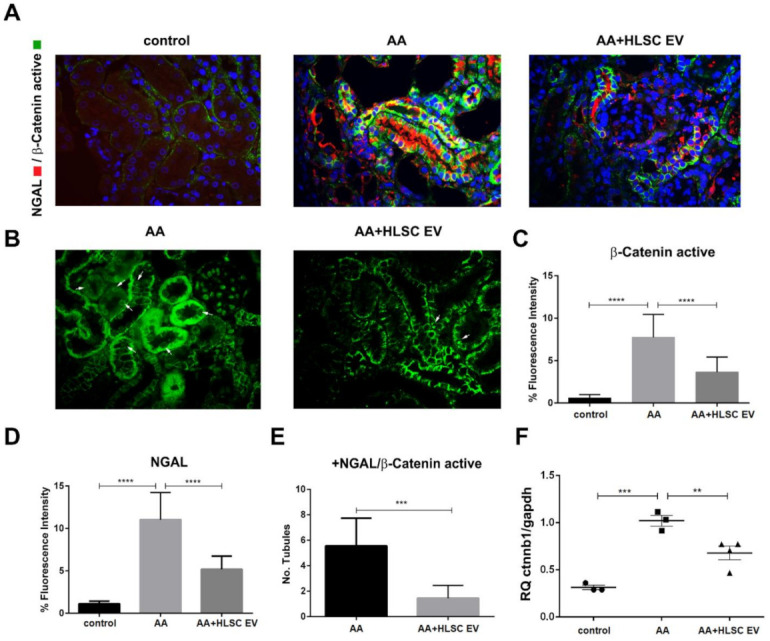
Figure 3.

Active β-catenin and NGAL are downregulated by HLSC-EVs in AAN. (A) Representative immunofluorescence images show increased expression of active β-catenin and NGAL in AAN mice, which are downregulated following treatment with HLSC-EVs (AA and AA+HLSC EV) (magnification 400×). (B) The white arrows show nuclear localisation of β-catenin active in AA and AA+HLSC EV experimental groups (magnification 400×). (C) Histogram depicting the percentage fluorescence intensity of β-catenin active and NGAL (D) in the experimental groups. Data represent mean ± SD of the fluorescence intensity measured from 10 images per high power field taken at random (C,D) (n = 5 mice per group). **** p < 0.0001 AA vs. control and AA+HLSC EV vs. AA. (E) the number of tubules positive for colocalisation of NGAL and β-catenin active in AA and AA+HLSC EV experimental groups. Data represent mean ± SD of the number of tubules counted from 10 images per high power field taken at random (n = 5 mice per group). *** p < 0.001 AA+HLSC EV vs. AA. (F) Gene expression level of Ctnnb1 in kidney tissue from AAN mice experimental groups. ** p < 0.01, *** p < 0.001 AA vs. control and AA vs. AA+HLSC EV. (n = 3 mice for control and AA, and n = 4 mice for AA+HLSC EV) RQ – relative quantity of Ctnnb1 gene vs. housekeeping Gapdh gene.
