Fig. 3.
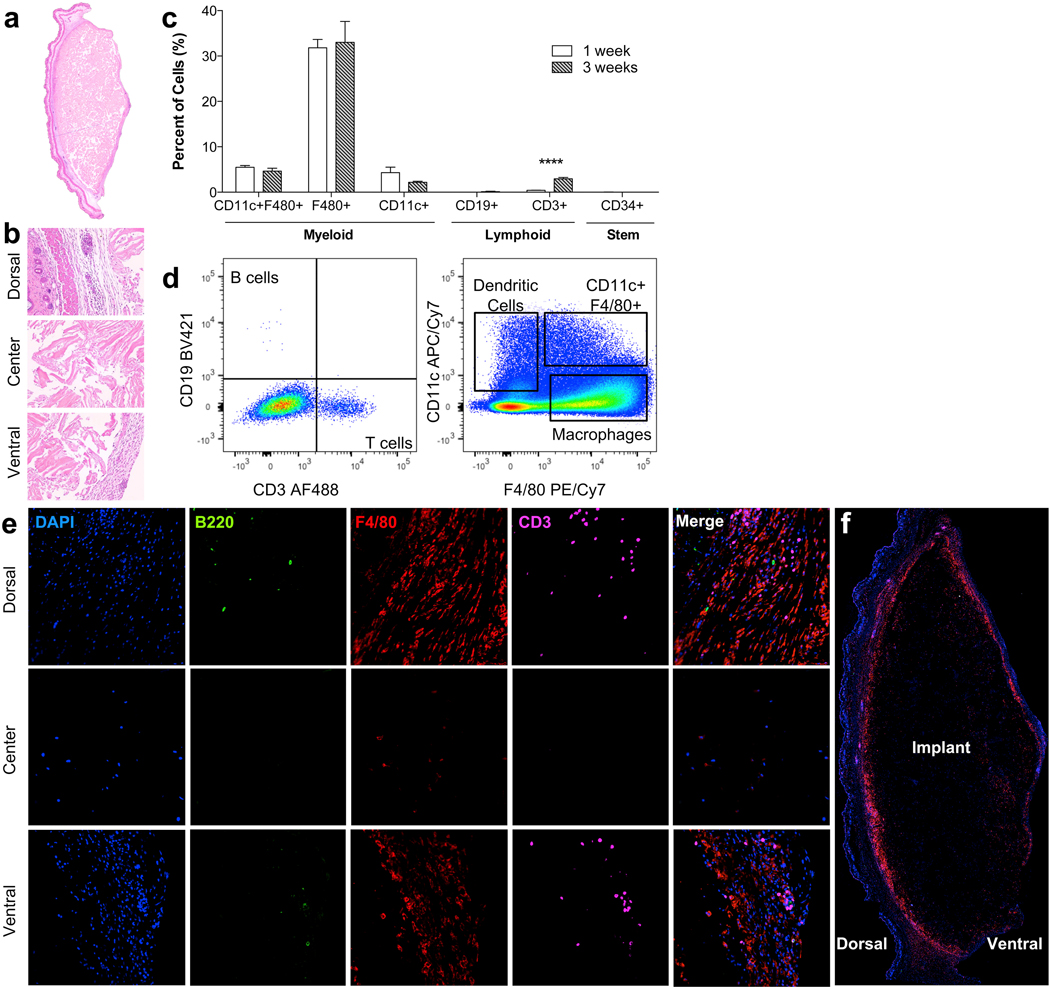
The scaffold immune microenvironment of UBM. C57BL/6 mice received 200 ul of a 300 mg/ml subcutaneous UBM implant. (a) Cross-section of subcutaneous UBM implant at 1 week post-injection. (b) Dorsal (skin), center, and ventral (capsule) sections of UBM implant at 1 week post-injection. (c) FACS analysis of resident immune cells at 1 and 3 weeks post-injection showing high presence of F4/80+ macrophages and an increase in CD3+ T cells over time. (d) Representative FACS plots from data quantified in (c). (e) Immunofluorescence (IF) staining of implant at 1 week post-injection showing localization of B cells (B220, green), macrophages (F4/80, Red), and T cells (CD3, magenta). (f) Composite cross-section of IF-stained implant at 1 week post-injection.

