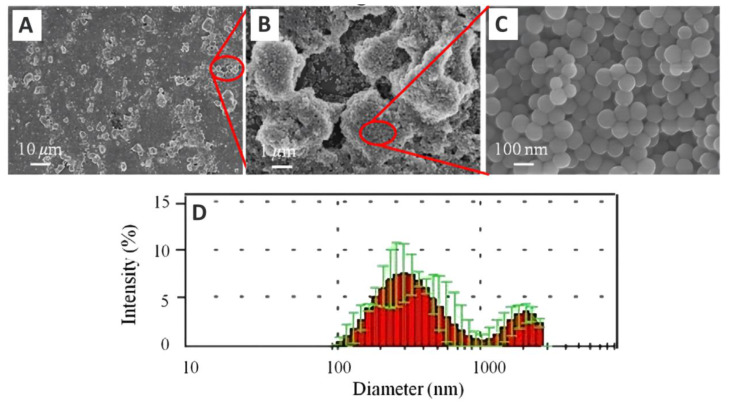
Figure 9.
FE-SEM micrographs and particle size distributions of silica bimodal nanoclusters and magnified to varying degrees, indicated with scale bars of 10 μm (A), 1 μm (B) and 100 nm (C) at selected regions, and their size distribution (D), respectively.Images from [96].

