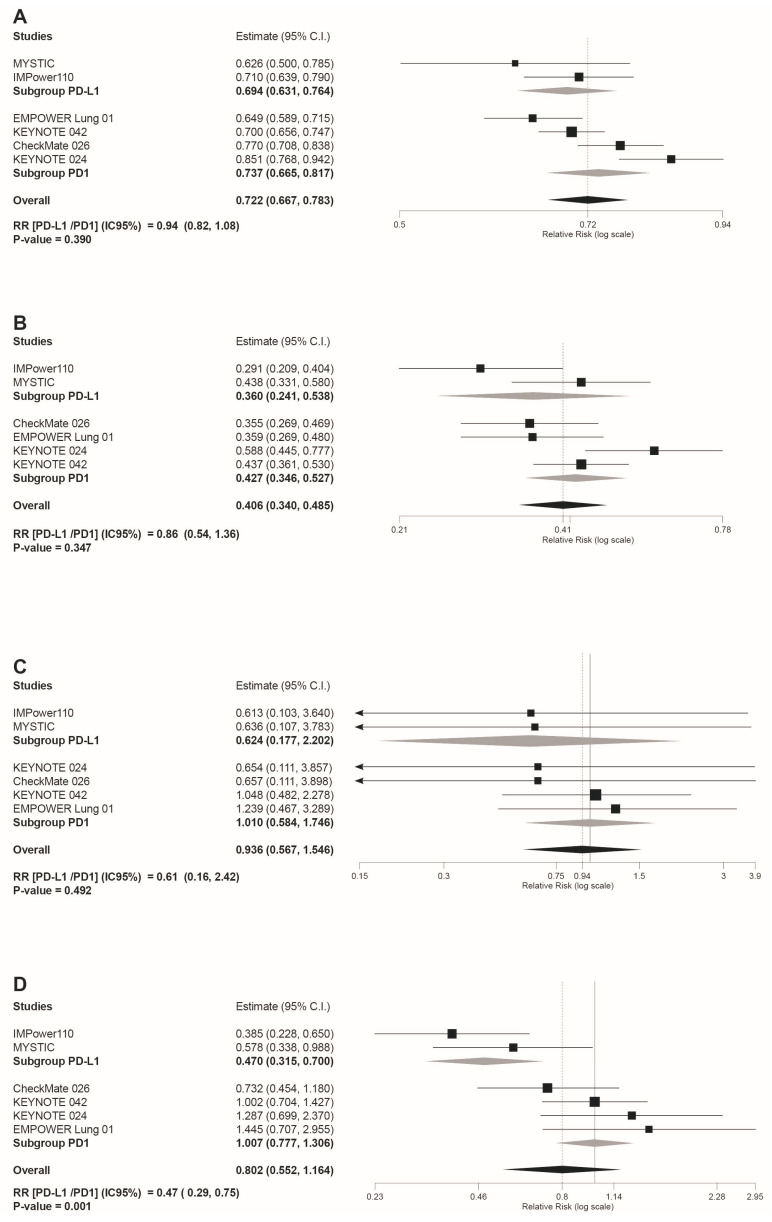
Figure 4.
Forest plot of pooled risk ratios (RR) in the subgroup analysis((anti-PD-L1) versus (PD-1 inhibitors)) for: (A) any grade trAEs; (B) grade 3–4 trAEs (C) grade 5 trAEs; (D) AEs leading to discontinuation. Estimate, RR; CI, confidence interval. RR of ((anti-PD-L1) versus (PD1 inhibitors)) is shown at the bottom left. Treatments are ordered from top to bottom by lower to higher RR. Black squares indicate the weight of each RCT in the MA. The black rhomb indicates the weighted overall immunotherapy RR versus chemotherapy. Grey rhombs indicate, respectively, the weighted RR for anti-PD-1 immunotherapy subgroup compared to chemotherapy, and the weighted RR for anti-PD-L1 immunotherapy subgroup versus chemotherapy. The I2 index values measuring the heterogeneity of effect-size estimates from the individual studies in MAs A to D correspond respectively to: (I2 = 74.15%, p = 0.002); (I2 = 61.78%, p = 0.023); (I2 = 0%, p = 0.954); and (I2 = 67.83%, p = 0.008).

