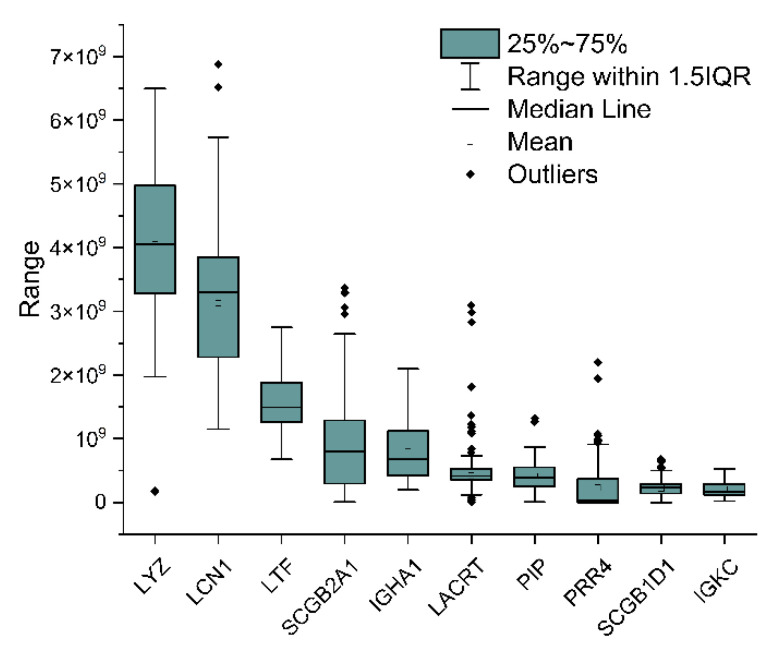
Figure 6.
Box plot of the intensity of the 10 most abundant proteins over 70 runs. Each box represents the interquartile range between the 25th and the 75th percentile, whereas the whiskers represent the range between the 5th and the 95th percentile. The median and mean values are also reported, as a line and an empty square, respectively. Outliers are represented by black diamonds. Proteins are indicated by their gene name: LYZ, lysozyme C; LCN1, lipocalin-1; LTF, lactotransferrin; SCGB2A1, mammaglobin-B; IGHA1, immunoglobulin heavy constant alpha 1; LACRT, extracellular glycoprotein lacritin; PIP, prolactin-inducible protein; PRR2, proline-rich protein 4; SCB1D1, secretoglobin family 1D member 1; IGKC, immunoglobulin kappa constant.

