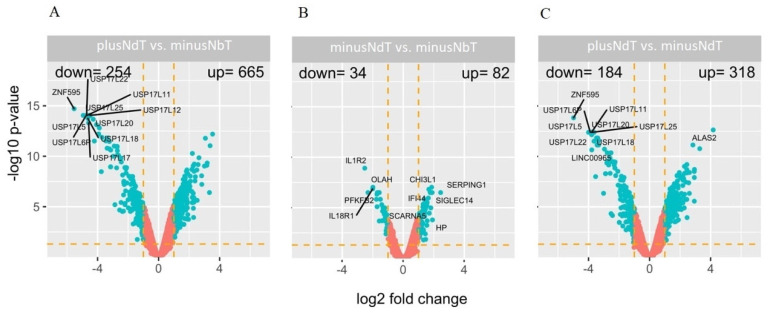
Figure 1.
The volcano plot of global gene expression. Graphs (A–C) show comparisons with different groups. (A) patients with neuropathy during treatment (plusNdT) vs. the group of patients without neuropathy before treatment (minusNbT); (B) patients without neuropathy during treatment (minusNdT) vs. the group of patients without neuropathy before treatment; (C) patients with neuropathy during treatment vs. patients without neuropathy during treatment. Genes are represented by dots. The graphs show the genes with at least two-fold change and p < 0.05. The graphs also contain the symbols of the genes with the largest change in expression.

