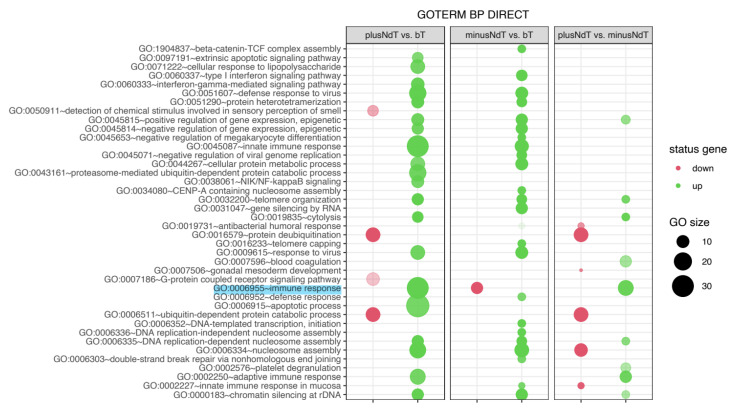
Figure 2.
The bubble plot of biological processes assigned according to gene ontology (GO) classification. Genes assigned to individual processes fulfilling the criteria—adjusted p < 0.05, method of Benjamini, and minimum number of genes per group = 5—are presented. The bubble size indicates the number of genes represented in the corresponding annotation.

