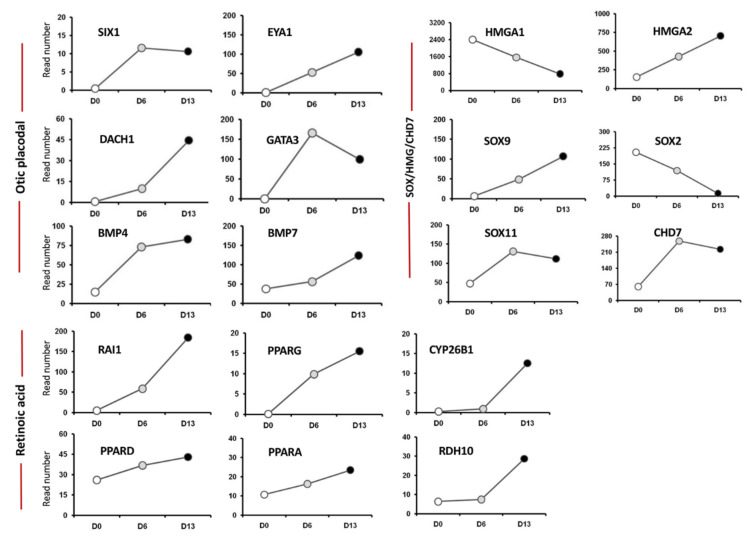
Figure 2.
Analysis of cell lineage trajectories by HTS of hiPSCs-derived otic sensory cells. The figure shows read numbers of otic/placodal lineage-specific (SIX1, EYA1, DACH1, etc.), SOX/HMG/CHD7 (SOX9, SOX11, HMGA2 and CHD7) and RA signaling pathway (RAI1, CYP26B1, RDH10,…) gene markers that are gradually enriched during the time course of otic induction at day 6 and day 13 in vitro as compared to undifferentiated hiPSCs at day 0 in vitro.

