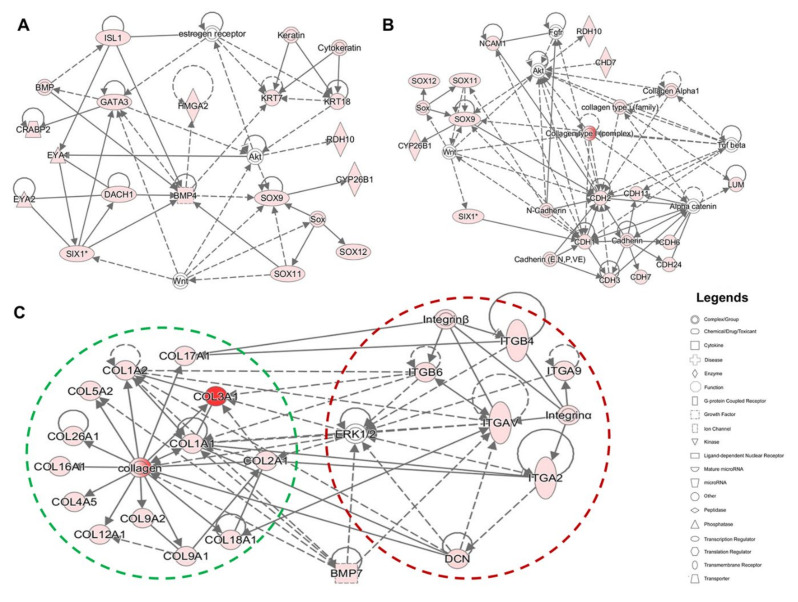
Figure 7.
Functional network analysis of upregulated genes during the time course of human otic sensory differentiation in vitro. (A,B) The most significant IPA network assembled around otic/placodal gene (EYA1, SIX1, DACH1, etc.) markers and their direct and indirect interactions with SOX (SOX9, SOX11), RA (CYP26B1, RDH10) and HMGA2 genes in day 13 differentiated cell cultures. (C) The most significant IPA network assembled around ECM and their cellular integrin receptors (ITG) in day 13 cultures showing the networks of COL1A1 and COL2A1 and their close interactions with other Collagen and DCN genes. Furthermore, the network showed additional direct and indirect interactions between ECM and ITG genes. ERK1/2 and BMP7 genes displayed both ECM and ITG indirect interactions. Nodes shaded in pink represent protein-coding genes that are upregulated in day 13. The intensity of the node color indicates the degree of up-regulation. Edges (lines) and nodes are annotated with labels that illustrate the nature of the relationship between genes and their functions. A solid line represents a direct interaction and a dotted line an indirect interaction.

