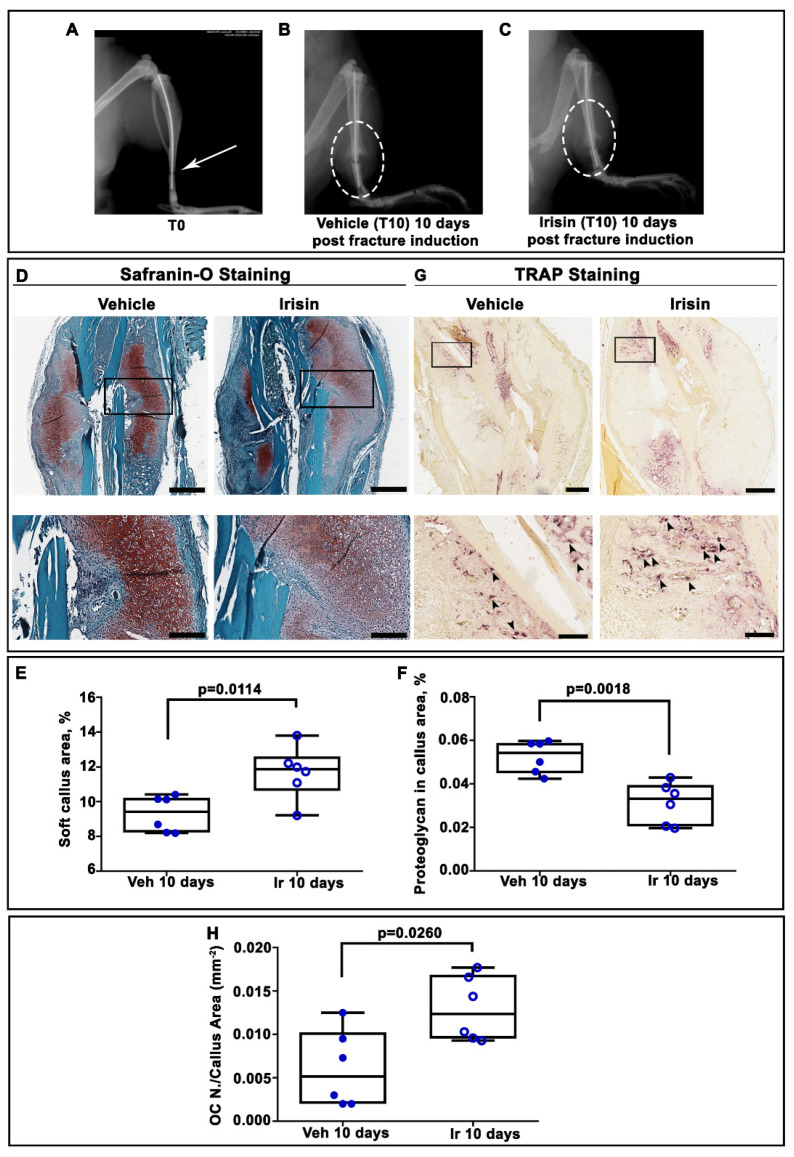
Figure 1.
(A) Representative radiological images of fractured tibia at Time 0 (T0), and mice intermittently treated with (B) normal saline (vehicle) or (C) irisin at 10 days post-fracture. (D) Representative Safranin O-staining images of callus sections from vehicle- and irisin-treated mice at 10 days post-fracture (scale bar 0.8 mm). The black squares indicate the areas of higher magnification (scale bar: 60 μm). (E) Dot-plot graphs showing the increased soft callus area and (F) decreased proteoglycan-rich cartilage matrix in irisin-treated mice (n = 6) compared with vehicle-treated mice (n = 6). (G) Representative Trap staining images of callus sections from vehicle- (n = 6) and irisin-treated (n = 6) mice at 10 days post-fracture (scale bar: 0.8 mm). The black squares indicate the areas of higher magnification. (H) Dot-plot graph showing the significantly increased number of Trap-positive cells in the callus area (OC n. /CA) in irisin-treated mice (n = 6) compared with vehicle-treated mice (n = 6) (scale bar: 60 μm). Data are presented as dot-plots with medians, from maximum to minimum, with all data points shown. The Mann–Whitney test was used to compare groups.

