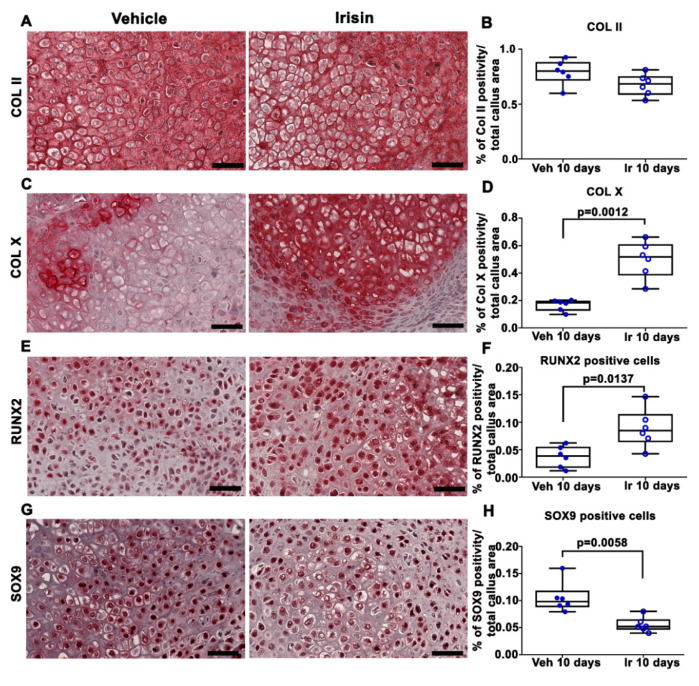
Figure 2.
Representative images of (A) COL II, (C) Col X, (E) RUNX2 and (G) SOX9 immunostaining in callus sections from vehicle-treated mice (n = 6) and irisin-treated mice (n = 6) at 10 days post-fracture (scale bars: 20 µm). Dot-plot graphs showing the quantification of (B) COL II, (D) COL X, (F) RUNX2 and (H) SOX9 expression. Data are presented as dot-plots with medians, from maximum to minimum, with all data points shown. The Mann–Whitney test was used to compare groups.

